Alberto Cairo: 'Make it visual and people will understand'
May 27, 2015
In the first part of my interview with Alberto Cairo, he talked about what is journalism and what roles science and visualization play in that. I this second part he talks about interactivity in visualization, graphicacy, coding and the role of visualization in science and education.
What does the future of visualization look like?
Alberto Cairo: 'I have no idea. But I do believe that it can be learned by anybody and that it an be learned by anybody.'
Can interactivity be the next big thing in visualization?
Alberto Cairo: 'Absolutely. That is what we are trying to implement at the University of Miami at the moment. The only visualization course right now is my class. In my class students learn the principles and they learn how to apply those principles to the real world, creating static illustrations, using Illustrator, Tableau and a little bit of R. They might create some interactive visualizations in Tableau, but as you know Tableau is limited in that respect.
I identified that that is not enough. So we created a second class, on top of mine, called Advanced Data Visualization. Students who have already taken my course will go that class, which is all about D3: an entire semester of D3.
The Advanced Data Visualization class will be taught by external people. And I'm planning to take the class as a student myself, by the way, next semester.'
You are not a programmer yourself?
Alberto Cairo: 'No. I know how to program a little in R and ggplot2, and I know a little about D3. But if you tell me to create an interactive visualization... I know where to start and I know how to plan for it. So I can imagine it, I can draw it and I can create a very detailed visual mockup in Illustrator. But when the time comes to actually implement it, I go to a programmer. I do that all the time. That was the way I worked in Brazil, for example. But I'm not a programmer by any means.'
In March and April you taught the MOOC Data visualization and infographics with D3.js.
Alberto Cairo: 'That's right, I'm teaching with Scott Murray. But technically it wasn't a MOOC, because it was not open. Participants also had to pay. It cost 100 dollar. Not a lot of money for the training that you get.'
https://www.youtube.com/watch?v=7Nuyj6nNnnY
'The success of the course was really a suprise.
I have this bias that all journalists have: I tend to believe that people don't pay for content on the internet. So when we were planning, I thought that we were going to have like 30 or 40 people participating. We were just getting a little bit of money and 30 people form a nice group. We could have nice conversations and stuff. And then suddenly, the course was open. It was not announced, I just tweeted 'Registration is open for the course with myself and Scott'. Two hours later, there were already 100 people registered. 100 people! And the course closed in one week. After one week we reached the cap of 200 people, so we decided to increase the cap. We brought in more instructors. So Scott was the main instructor on the D3 side, but he had 2 or 3 people collaborating with him.
I was responsible for the conception part. So when anybody asked 'What kind of graphics should I use here? Should I use a map or a graph?' I answered those questions. It was a huge success, up to the point that we are running a new course after the summer.
I think it will fill up again. People want to learn, which is great. And they want to learn what we do, which is even better.'
A big challenge in visualization today is that many people suffer to interpret graphics correctly. Will people become more 'visually literate'?
Numeracy and graphicacy can and should become universal skills.
Alberto Cairo: 'I don't know, but I am certainly putting all my effort in that. I do believe that numeracy and graphicacy, which is graphical literacy, can and should become universal skills, just like literacy.
There is actually a list in my next book. Mark Monmonier, a cartographer, wrote a very good book called Mapping it out. He put together a list of skills that many people lack. On that list are
- literacy: reading and writing
- articulacy: being able to articulate yourself using spoken words
- the third one was numeracy, which is being able to not necessarily deal with statistics, but quantitative reasoning: thinking about numbers.
- The fourth one he put in there was graphicacy: being able to interpret and create graphics
In the middle I would put a fifth one. I do believe that there is another skill in there that we need to have, that we could call 'computeracy'. Understanding how computers work, what underlies computers and being able to code. Not everybody has to become a professional programmer, but everyone should acquire some programming skills. It doesn't really matter what you learn.'
Like for example Excel formulas?
Alberto Cairo: 'I would say a little more than that. Learning a little bit of Processing for example, or R or Python. Each programming language has a different syntax and vocabulary, but the underlying principles? They are all the same: variables, arrays, conditionals. They are applicable to every programming language, and they change the way you operate completely. If you understand what actually underlies the functioning of computers, that changes you, it changes our mind.
So that is the fifth skill. I do believe that those five skills need to be addressed in school. And we are not teaching them well, particularly not numeracy and computeracy.
My own students don't know what a computer is. They know how to use Facebook, they know how to use Twitter, but they don't know what a computer is or how it works. Graphicacy? Also nothing. They learn a little about bar graphs and pie charts in highschool and that's it. But they don't learn how to use maps or charts for their own advantage. And that is a skill that needs to be taught.
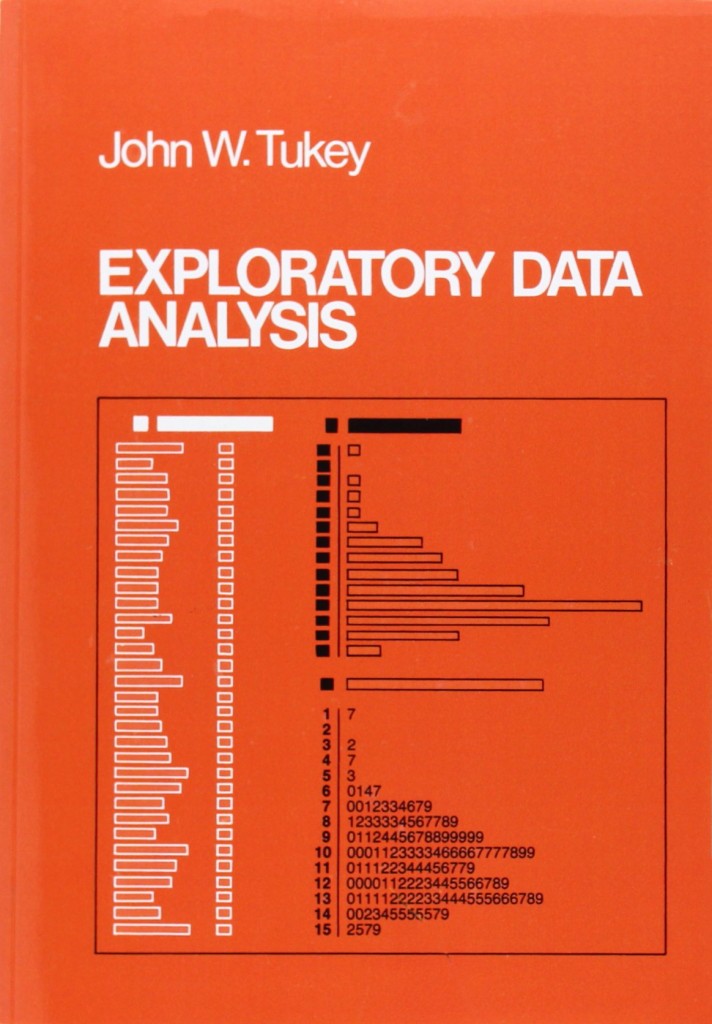
This morning [in his keynote for the NTTS2015 conference] I mentioned John Tukey. He is the founder of exploratory data analysis, a branch of statistics. And what is exploratory data analysis? It's visualization for exploration. And that is so helpful. It let's you explore the data in a more fun way. People like that. When you explain it and say: "Open Tableau and play a little with the data.," people say: "Wow, I have never seen the data like this." People get excited. It is a manner of raising curiosity.
And after you do that, after you have opened that door, it is much easier to explain the underpinnings of statistics. It is much harder to teach statistics when you begin with "here are the descriptive statistics and here are the formulas." People get bored! Because not everybody is a nerd. I like that approach, that's how I learned statistics. But that's why I hated it when I was in school. It was only after that, reading on my own, that I discovered how fun it can be. So, why don't we teach it that way?
It is not something that I made up. Statisticians themselves were saying that 40 years ago. So why have we not made that change? Why didn't we listen to Tukey when he said that? And after you explored the data, then you can go to confirmatory analysis, hypothesis testing, ... People will be in a good mood at that point. They'll already know that there is something interesting in there. So they will be more willing to learn the harder stuff: variance analysis, hypothesis testing, ... whatever. That is hard, those are formulas. But they will be in a good mood. They have already understood that they can learn. That is the thing.
Statistics and data analysis in general are seen as magic, just because we teach them like if they were magic. Formulas and formulas and more formulas.
Statistics and data analysis in general are seen as magic, just because we teach them like if they were magic. Formulas and formulas and more formulas. Go with the visual stuff, the most engaging stuff, get people excited about that kind of information.'
Did you read my blogpost on the rise of Explorable Explanations?
Alberto Cairo: 'Yeah, that is how you really need to explain things like a normal distribution or how to calculate a p-value for example. You can do that visually, you can show the distributions merging, on top of each other. People understand that. If you explain all that with words and with formulas, most people will get lost, they will not understand it. But when you put the visuals in? Absolutely: they will get it.
So, that's a whole area that needs to be developed. There are a lot of people working on that, obviously, but there is a lot of work to be done.'