Magic in Graphs
January 25, 2017
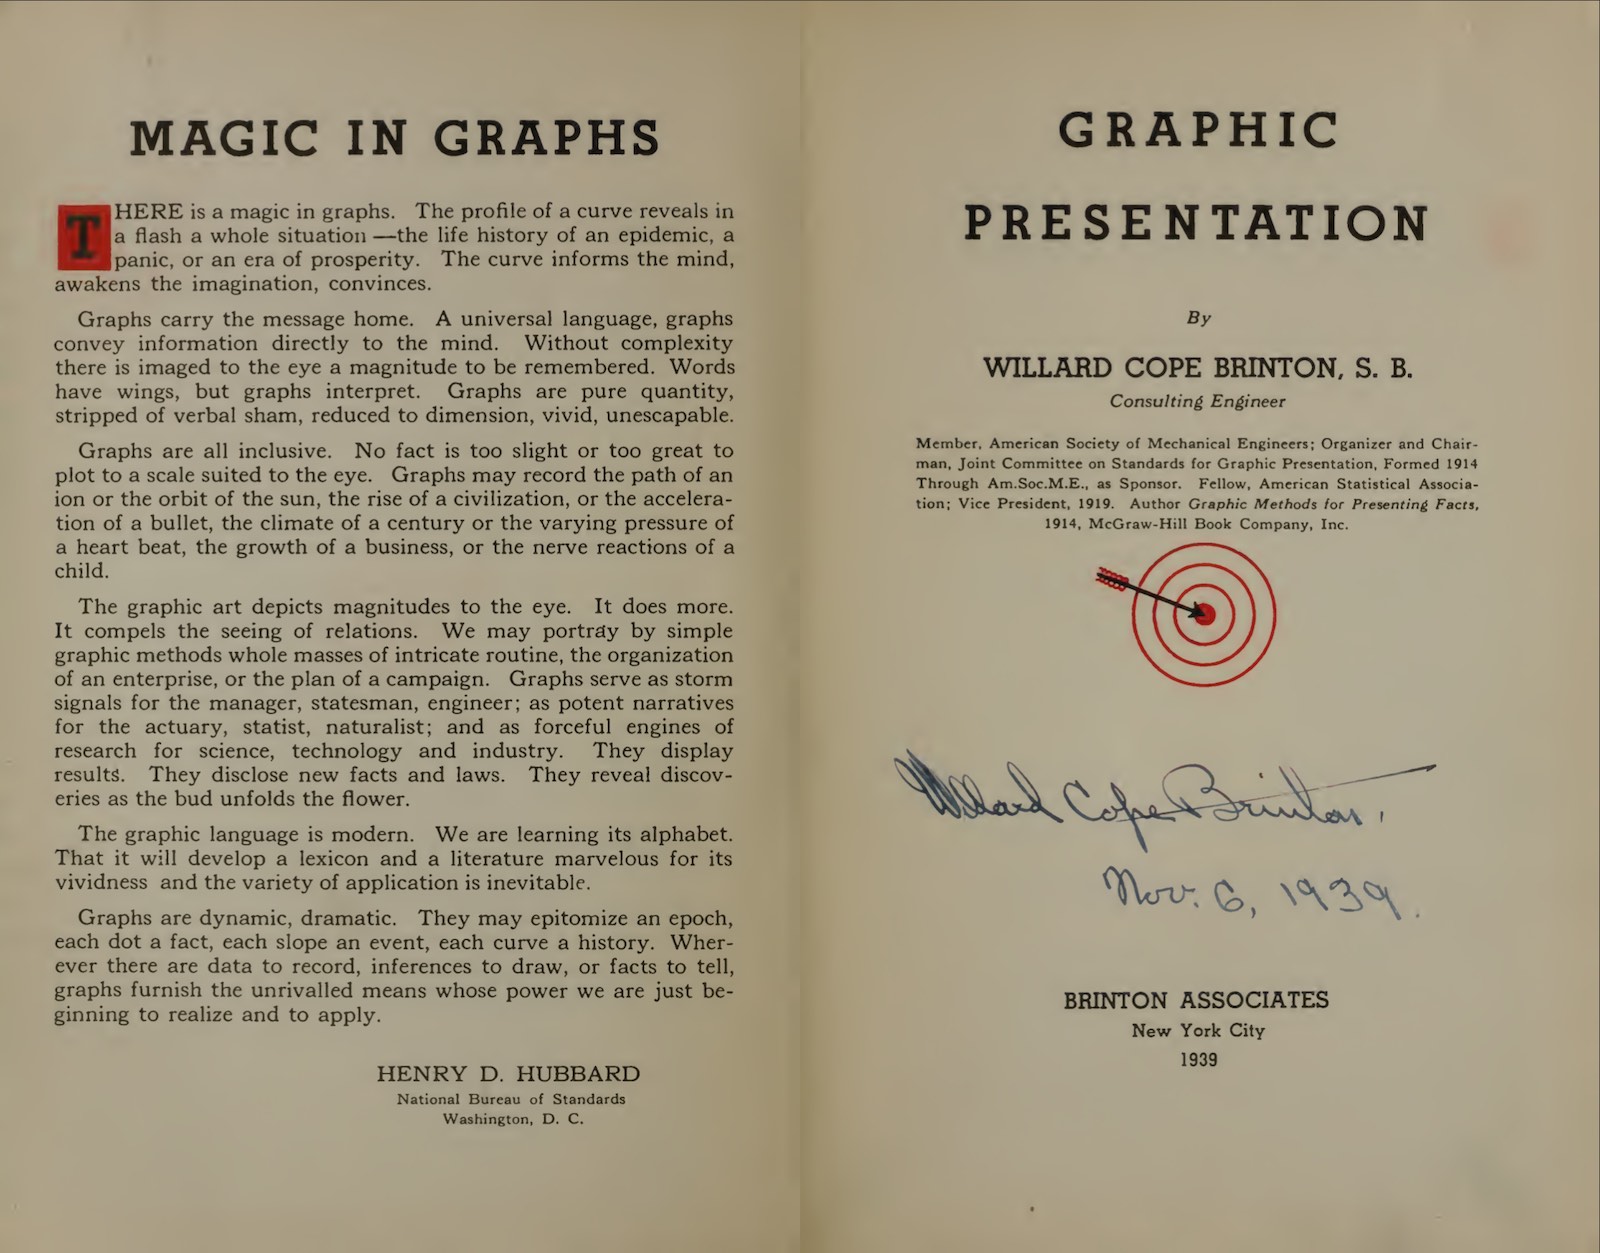
I recently started reading Graphic Presentation (read or download it here), a classic data visualization book by Willard C. Brinton, published in 1939. The book is full of interesting charts, commented on very well by Brinton. It is often described as a gold mine, and for chart lovers like myself, it definitely is.
I especially like the introduction to the book, by Henry D. Hubbard from the US National Bureau of Standards. ‘Magic in Graphs’ is an ode to charts as you wouldn’t read anywhere today: very optimistic and full of believe in this new language. 77 years later we are still learning its alphabet and we’ve learned that sometimes there can be black magic in graphs. Nonetheless, it was a heartwarming little read for me.
Magic in Graphs
There is magic in graphs. The profile of a curve reveals in a flash a whole situation -the life history of an epidemic, a panic, or an era of prosperity. The curve informs the mind, awakens the imagination, convinces.
Graphs carry the message home. A universal language, graphs convey information directly to the mind. Without complexity there is imaged to the eye a magnitude to be remembered. Words have wings, but graphs interpret. Graphs are pure quantity, stripped of verbal sham, reduced to dimension, vivid, unescapable.
Graphs are all inclusive. No fact is too light or too great to plot to a scale suited to the eye. Graphs may record the path of an ion or the orbit of the sun, the rise of a civilization, or the acceleration of a bullet, the climate of a century or the varying pressure of a hart beat, the growth of a business, or the nerve reactions of a child.
The graphic art depicts magnitudes to the eye. It does more. It compels the seeing of relations. We may portray by simple graphic methods whole masses of intricate routine, the organization of an enterprise, or the plan of a campaign. Graphs serve as storm signals for the manager, statesman, engineer; as potent narratives for the actuary, statist, naturalist; and as forceful engines of research for science, technology and industry. They display results. They disclose new facts and laws. They reveal discoveries as the bud unfolds the flower.
The graphic language is modern. We are learning its alphabet. That it will develop a lexicon and a literature marvelous for its vividness and the variety of application is inevitable.
Graphs are dynamic, dramatic. They may epitomize an epoch, each dot a fact, each slope an event, each curve a history. Wherever there are data to record, inferences to draw, or facts to tell, graphs furnish the unrivalled means whose power we are just beginning to realize and to apply.
Henry D. Hubbard, National Bureau of Standards, Washinton, D.C.
Graphic Presentation, Willard C. Brinton, 1939