A look through history map of Flanders - the making of
October 28, 2019
During last year’s Christmas holidays, I spent some time developing a hobby project that I had been wanting to do for a long time. The oldest aerial imagery covering the whole of Flanders (the Belgian region I live in) dates from 1971, which is now almost 50 years ago. The data is freely available and has a spatial resolution of 1 meter, which means you can identify individual houses.
A random location, showing roads, houses, trees and fields, just to illustrate the resolution:
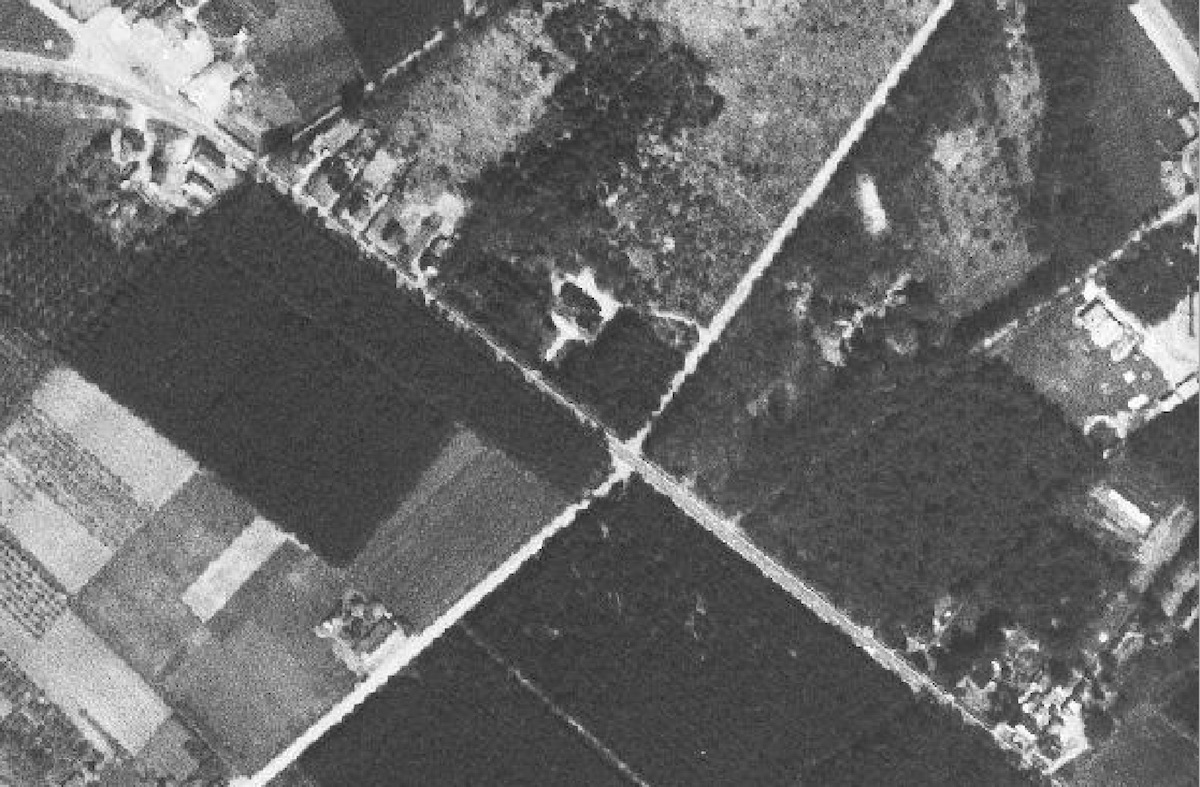
So I wanted to build a slippy map that would make comparing the historical imagery with recent satellite pictures as intuitive as possible. So in the rest of this post, I explain how I build the look through 50 years of history map of Flanders.
Getting the data
The satellite imagery is available as 43 zip files, each containing the imagery as a JPEG 2000 file (with extension .jp2) and a world file (with extension .j2w) containing the data to georeference the image file.
I used R to download all the files:
for(i in 1:43){
  #Added to track the download progress. Most of the zip files are around 400 MB, so it might to take some time to download them
  print(i)
  #The first 9 images have a leading zero in the file name
  if(i < 10){
    url <- paste(base.url, "0", i, ".zip", sep = "")
    download.file(url, destfile = paste("OKZPAN71VL_K0", i, ".zip", sep = ""))
  }
  else{
    url <- paste(base.url, i, ".zip", sep = "")
    download.file(url, destfile = paste("OKZPAN71VL_K", i, ".zip", sep = ""))
  }
}
I then unzipped everything, and moved all the images from their subfolders in the zip file to the root folder. In that process, I went ahead and changed the extension of the world files from .j2w to .tfw. I did this because in the next step I had to convert the JPEG 2000 files to GeoTIFF, and world files of GeoTIFF’s have a .tfw (they are the exact same files, but just have different file extensions).
for(i in 1:43){
  if(i < 10){
    index <- paste("0", i, sep="")
  }
  else{
    index <- i
  }
  file.rename(from = paste("OKZPAN71VL_K", index, "/JPEG2000/OKZPAN71VL_K", index, ".jp2", sep = ""), to = paste("OKZPAN71VL_K", index,".jp2", sep=""))
  file.rename(from = paste("OKZPAN71VL_K", index, "/JPEG2000/OKZPAN71VL_K", index, ".j2w", sep = ""), to = paste("OKZPAN71VL_K", index,".tfw", sep=""))
}
Transforming the data
I was going to use Mapbox as the platform to host and serve the imagery. That meant I could make use of the Mapbox Sattelite Streets base layer for the recent imagery. To add my own imagery to Mapbox, I created a Mapbox Tileset. With tilesets, you can just upload imagery, and Mapbox will take care of creating the tiles for 22 different zoom levels for you.
There is a limitation on what you can upload, though. For GeoTIFF, the limitation is 10 Gb. No problem there, as my data checked in at around 3.8 Gb. But to optimise the GeoTIFF for creating a tileset, Mapbox suggests the following:
- Reproject to Web Mercator EPSG:3857.
- Set blocksize to 256x256.
- If compression is needed, use LZW
I knew about the Web Mercator projection, but the other settings were a bit Chinese for me. So I had to Google a little bit for this one. With gdal_translate() function of the gdalUtils package, I could convert the JPEG 2000 files to GeoTIFFs optimised for Mapbox tilesets
for(i in 1:43){
  if(i < 10){
    index <- paste("0", i, sep="")
  }
  else{
    index <- i
  }
  print(index)
  jpg <- paste("OKZPAN71VL_K", index, ".jp2", sep="")
  tif <- paste("OKZPAN71VL_K", index, ".tiff", sep="")
  gdalUtils::gdal_translate(jpg, tif, ot="Byte", co=c("COMPRESS=JPEG","TILED=YES"), a_srs="EPSG:31370")
}
I then merged all 43 GeoTIFFs into 1 single file in QGIS. I don’t remember exactly why I did that in QGIS. Either QGIS was faster, or I didn’t find the right gdal function to use immediately. Sometimes running things through a GUI is just a bit faster than figuring how to do it with R packages you are not all to familiar with :-)
What didn’t work so well, though, was reprojecting a file that large in QGIS. So I used the gdalwarp() function of the gdalUtils package to reproject from the Belgian Lambert 72 projection (EPSG:31370) to Web Mercator (EPSG:3857).
gdalwarp("flanders71.tiff", "flanders71-pseudomercator.tiff", ot="Byte", s_srs="EPSG:31370", t_srs="EPSG:3857", co=c("COMPRESS=JPEG","TILED=YES"))Building the map
In order to have the map accessible in Mapbox, I added my new tileset to a Mapbox Style in Mapbox Studio. In Studio, I could also add a mask to hide all areas outside of Flanders, which are not covered by the imagery. I used a file with the boundaries of Flanders, and took the difference of this with a rectangular area covering Flanders and a large buffer around it with QGIS’s Difference Geoprocessing tool. This gave me a large rectangle, with a Flanders shaped hole in the middle. I saved the result as a geojson file, created a new Mapbox tileset with it and added this layer above the historical imagery in Mapbox Studio, with a full black color and no opacity. This served as a mask, so everything outside of flanders is just black on the map.
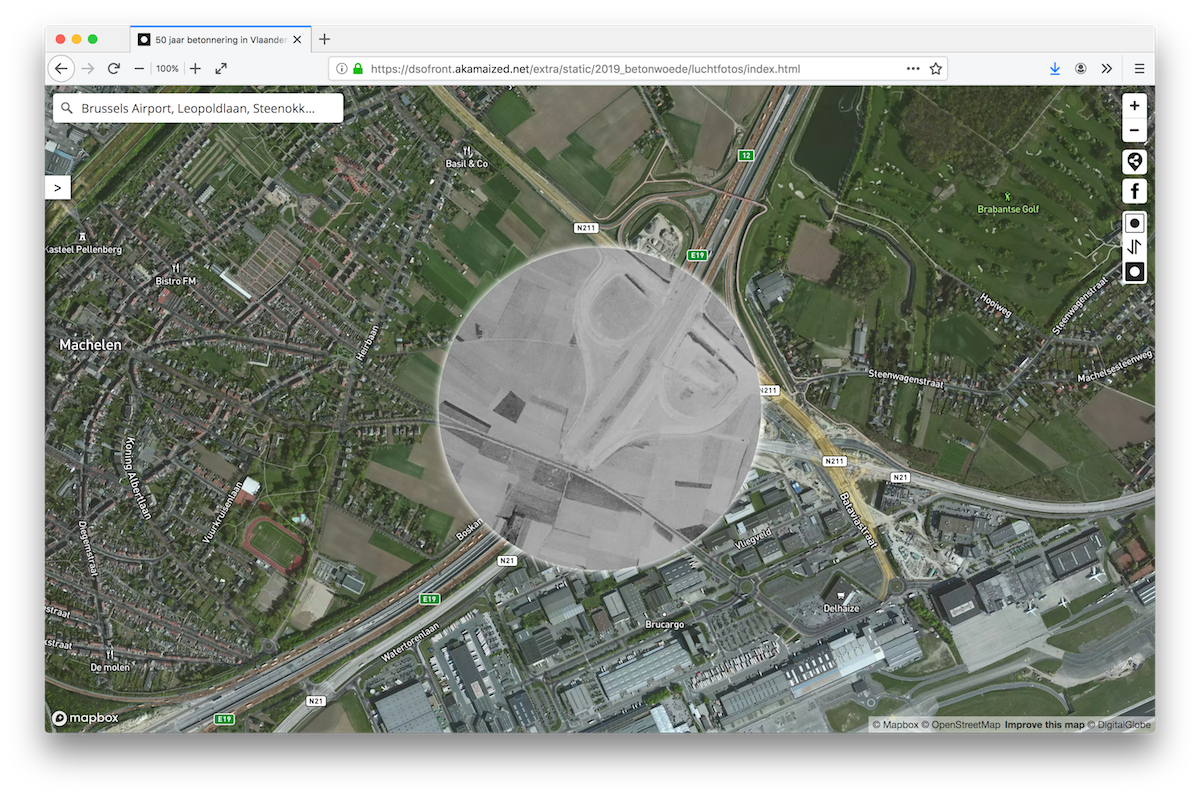
To build the look-through map I had in mind, I needed 2 Mapbox maps that would sync their locations with each other. Luckily, Mapbox has a plugin that exactly does that: mapbox-gl-compare.
With the plugin, you can create 2 Mapbox GL maps, and let them listen and update to eachother’s changes.
var beforeMap = new mapboxgl.Map({
//Mapbox map options
})
var afterMap = new mapboxgl.Map({
//Mapbox map options
})
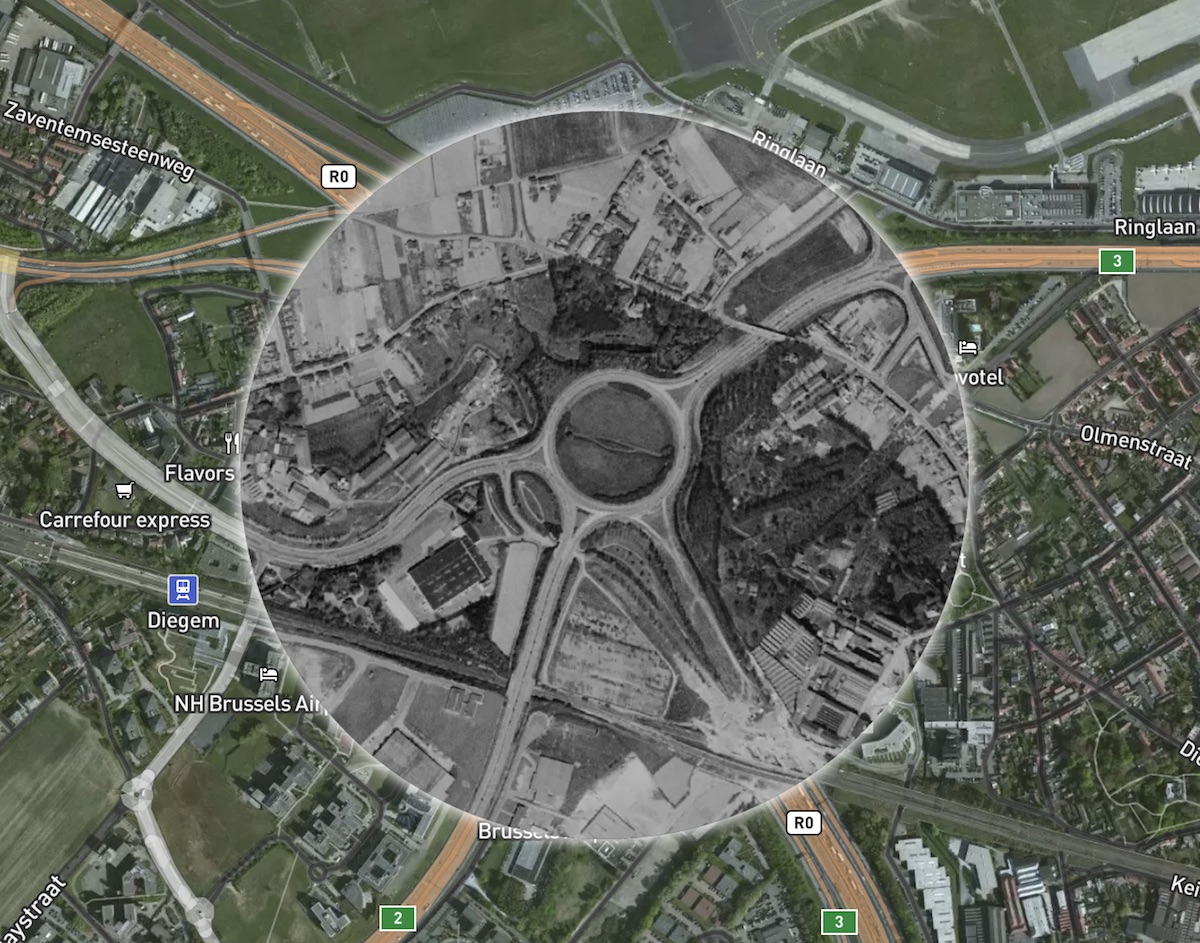
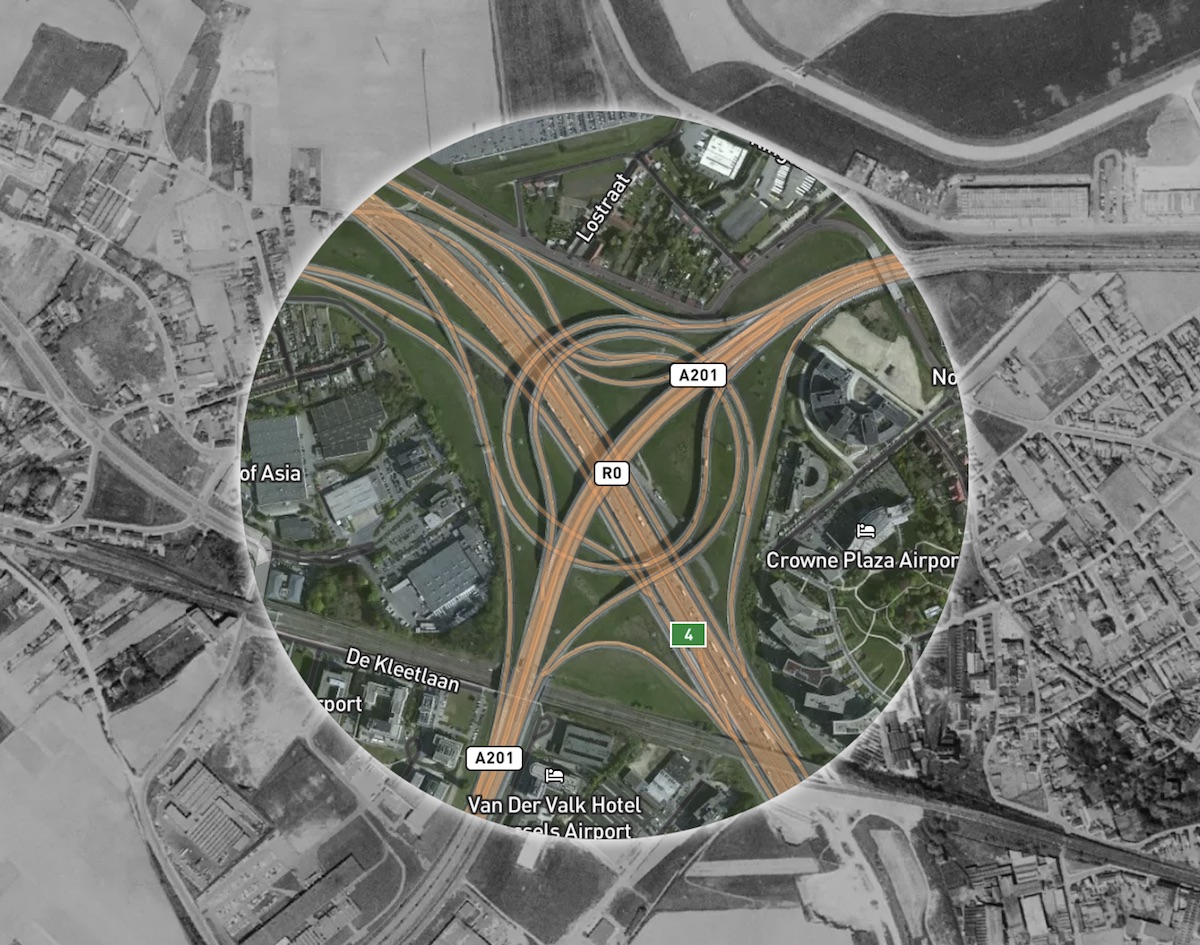
syncMove(beforeMap, afterMap);Most of the heavy lifting for the look-through map is done by css: the underlying map is covering the whole width and heigth of the window, while the other one is smaller, square, centered both vertically and horizontally, and has a border-radius of 100% (which makes it a circle). To make the border between both maps look a bit nicer, I added a little white dropshadow.
(I remember copying this css snippet from an example, but can’t find it anymore. By the way, my inspiration for this project was mainly Urban Scratchoff, by Chris Whong)
#beton-before-container, #beton-after-container.switched {
  margin: auto;
  position: absolute;
  top: 0; left: 0; bottom: 0; right: 0;
  width: 400px;
  height: 400px;
  border-radius: 100%;
  overflow: hidden;
  opacity: 1;
  box-shadow: 0px 0px 8px 2px #fff;
  /* Safari overflow hidden + border-radius bug https://hk.saowen.com/a/fd38838b1554e3bc311ebabb7c4cc3d7e44d62a45ba44bc2792172c6cd76c10a */
  -webkit-transform: translateZ(0);
  transform: translateZ(0);
  z-index: 2;
}
Notice the .switched class in the css selector. I added a button to the map to switch both layers, so the .switch class just switches the css of the containers of both maps.
I don’t know if the “switch map layers” icon in the switch button makes any sense at all :)

What’s in it for me?
All people I shared the map with, did one thing first: looking for their own home and street. So the map definitely needed a search field, so people could search for addresses. Mapbox has a geocoder plugin for this, so I used that. I needed to put the geocoder outside of the map, to always have it on top of the underlying maps.
Then I also added functionality to share a location. If you click the “share location” button, a url with the latitude, longitude and zoom level in the search parameters is copied to the clipboard.

So https://markup.standaard.be/extra/static/2019_betonwoede/luchtfotos/index.html?lng=5.108286000000021&lat=51.004717&zoom=16 will bring you right to the house I moved out of on the same day the map was published (true story, don’t ask).
For this to work, the button grabs the center and zoom of the one of the two maps when the button is clicked, constructs the url, puts it into a text field, and then the value of the input field is copied to the users clipboard. (my apologies for the “snappy” variable name. It’s a legacy thing…)
  var snappy = document.getElementById('beton-share');
  snappy.addEventListener('click', function(){
      var lng = afterMap.getCenter().lng;
      var lat = afterMap.getCenter().lat;
      var zoom = afterMap.getZoom();
      var url = "https://dsofront.akamaized.net/extra/static/2019_betonwoede/luchtfotos/index.html" + "?lng=" + lng + "&lat=" + lat + "&zoom=" + zoom;
      var urlcopy = document.getElementById('url-input');
      urlcopy.value = url;
      urlcopy.select();
      document.execCommand('copy');
      document.getElementById('share-alert').style.opacity = 1;
  });
Then, on the other side, the map needs to check if these search parameters are present in the url, and if they are, the default location and zoom level of the map are overriden:
var urlParams = new URLSearchParams(window.location.search);
//Default center and zoom
var lat = 51.0541608;
var lng = 4.2081272;
var zoom = 15;
var bounds = [2.359,50.6,6.05,51.532];

if(urlParams.has('lng') && urlParams.has('lat') && urlParams.has('zoom')){
    lat = +urlParams.get('lat');
    lng = +urlParams.get('lng');
    zoom = +urlParams.get('zoom');
}
var beforeMap = new mapboxgl.Map({
    center: [lng,lat],
    maxBounds: bounds,
    zoom: zoom,
    minZoom: 11,
    //other map options
}));

var afterMap = new mapboxgl.Map({
  //same stuff as above
});
The maxBounds option makes sure that the user cannot navigate to outside the given bounds (in my case this was the bounding box of Flanders), and the minZoom option prevents the user to zoom out to zoom levels for which the imagery is not really suited for.
How it was published
So I made a very rough prototype of the map at the end of last year, and did nothing with it accept for sharing it with some people of whom I thought they would find it interesting. But at the last Dataviz Belgium Meetup I got in touch with some people of newspaper De Standaard, and they mentioned preparing a big series about how the region of Flanders has wasted so much open space over the last decades due to poor spatial planning.
I only realised my hobby project might be of interest to them a few day laters. So I pitched and showed my map, and they really liked it. They invited me to discuss the project, and I made them an offer, which they accepted.
So the map was launched on Saturday morning, and is now at 58.000 sessions, and +150.000 search queries. Not bad for a hobby project, hidden behind a paywall :)