My contribution to the World Bank Sustainable Development Goals Atlas
July 05, 2021
During almost all of 2020, I was involved in the development of the Sustainable Development Goals Atlas 2020. As the Atlas describes itself:
The Atlas of Sustainable Development Goals 2020 presents interactive storytelling and data visualizations about the 17 Sustainable Development Goals. It highlights trends for selected targets within each goal and introduces concepts about how some SDGs are measured.
For the development, I was part of a small data visualization team, together with Jan Willem Tulp, Elbert Wang, and Yaryna Serkez. We worked closely with the Atlas’ editors team, dividing the work of developing the storylines, compiling the data, and writing the text.
We divided the 17 articles among the visualization team. I developed the stories for
- Goal 2: Zero hunger
- Goal 3: Good health and well being
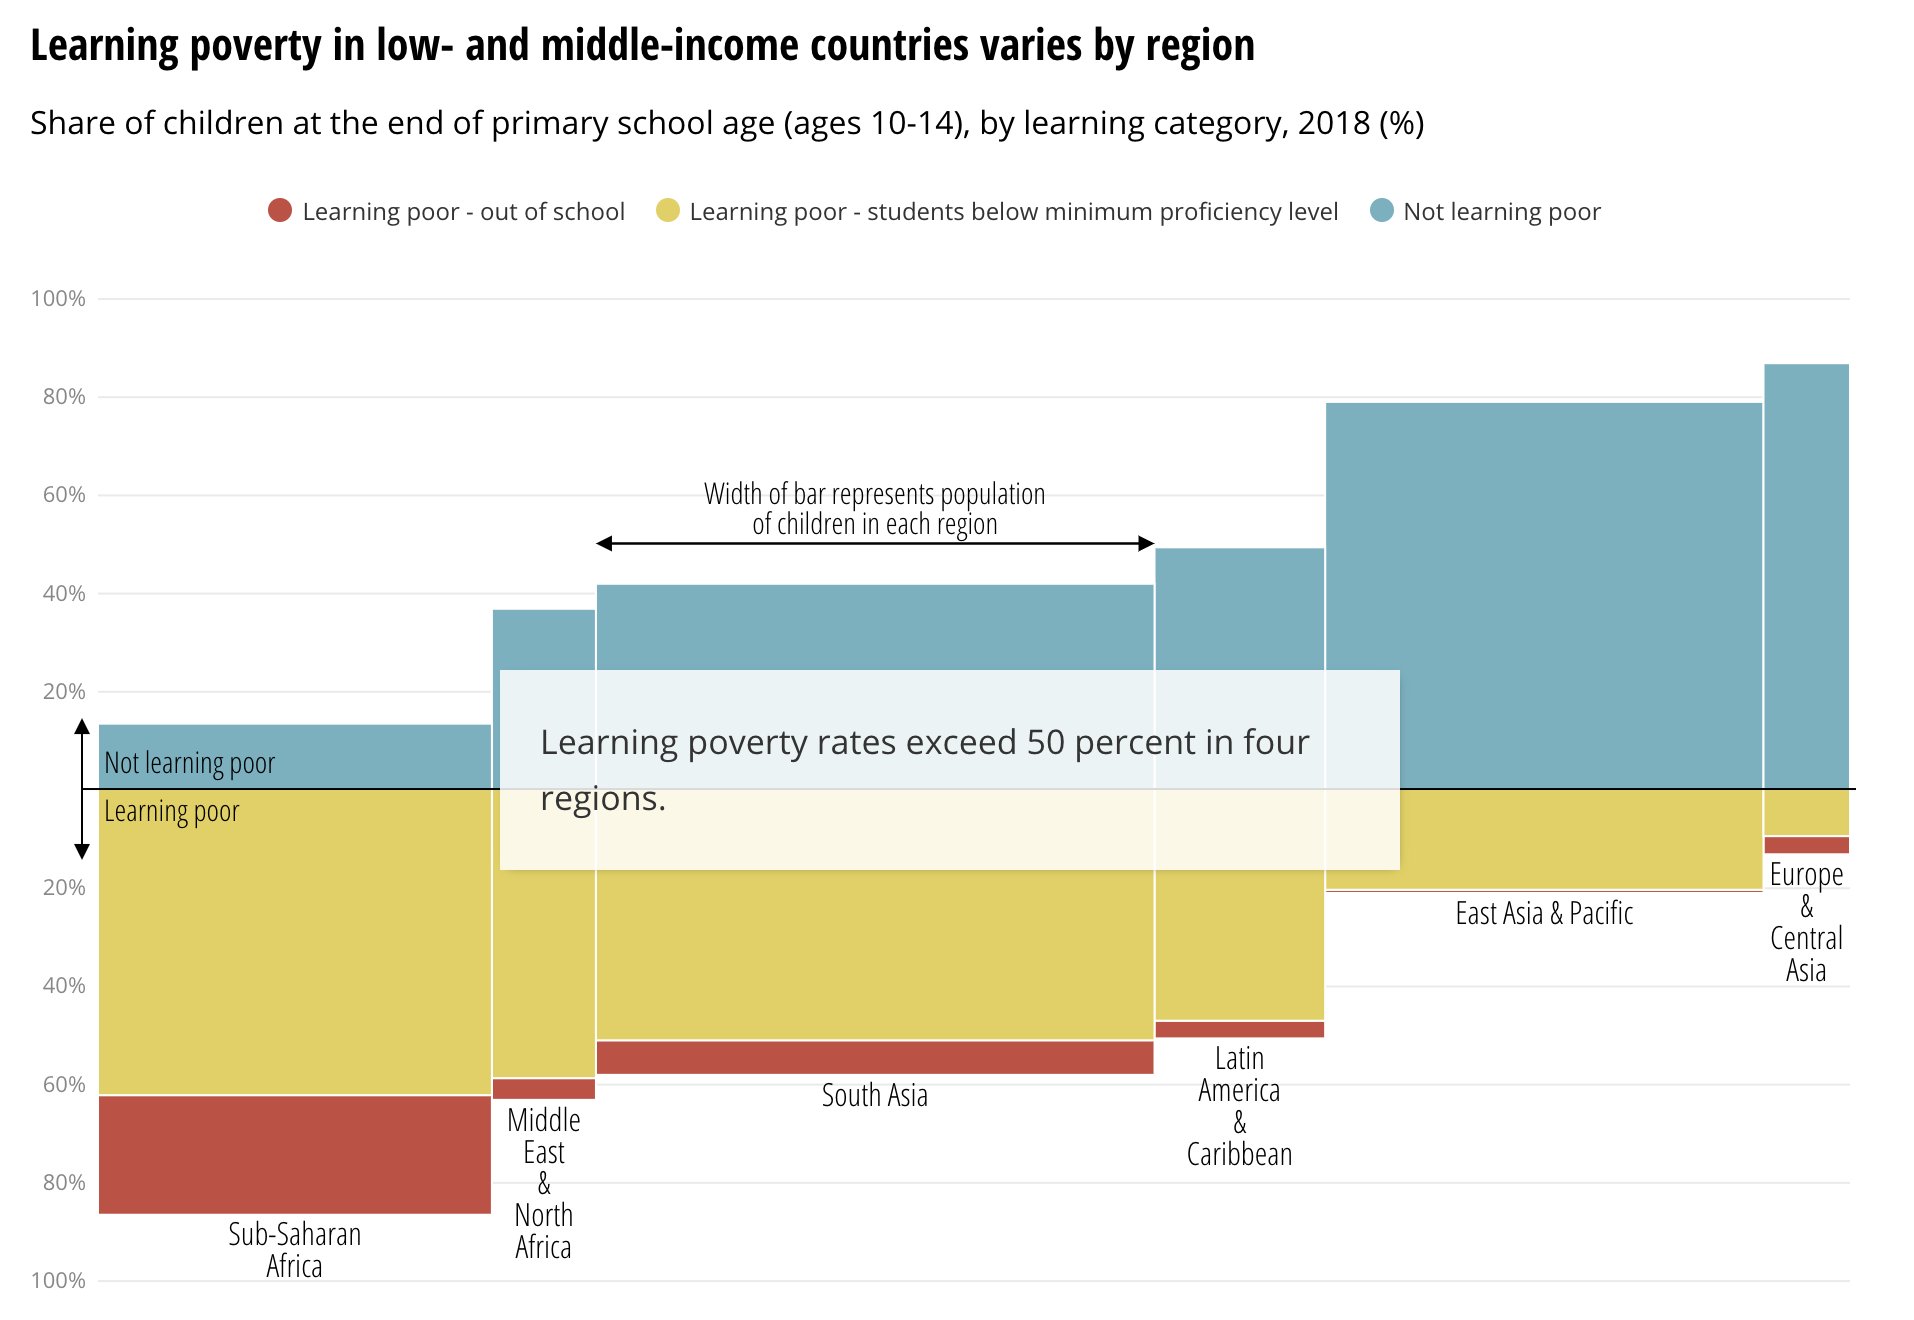
- Goal 4: Quality education
- Goal 5: Gender equality
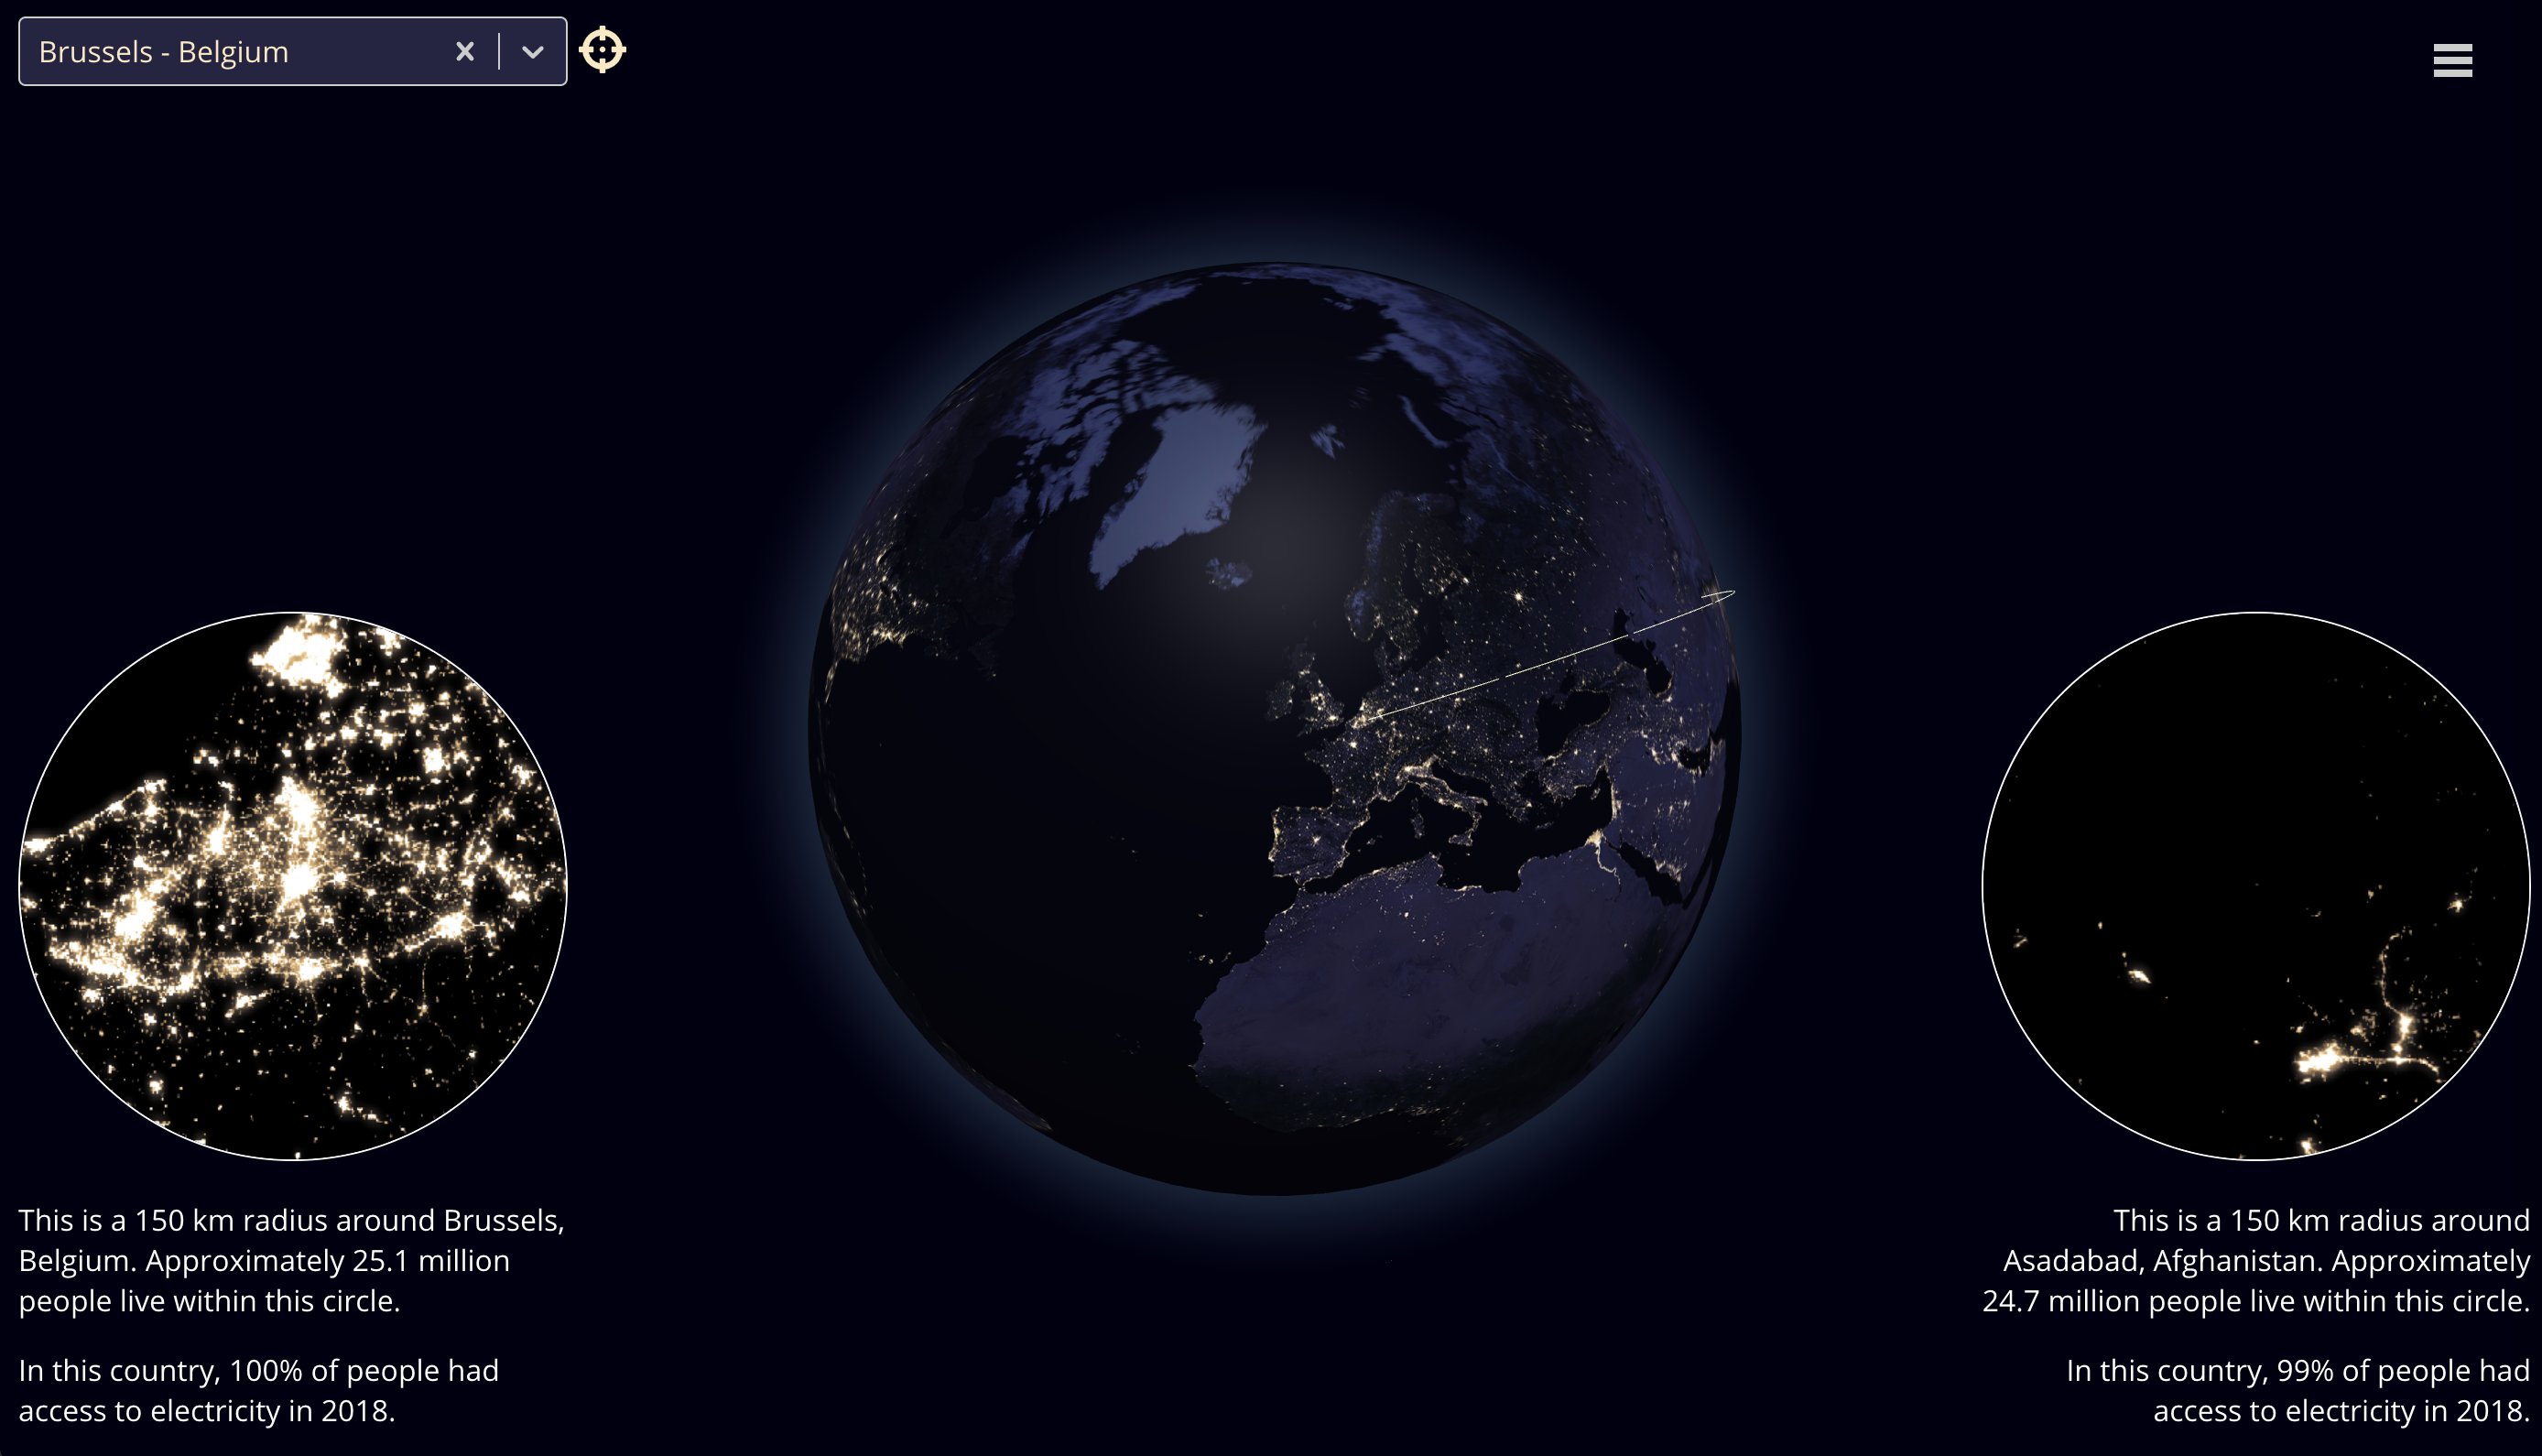
- Goal 7: Affordable and clean energy
- Goal 8: Decent work and economic growth
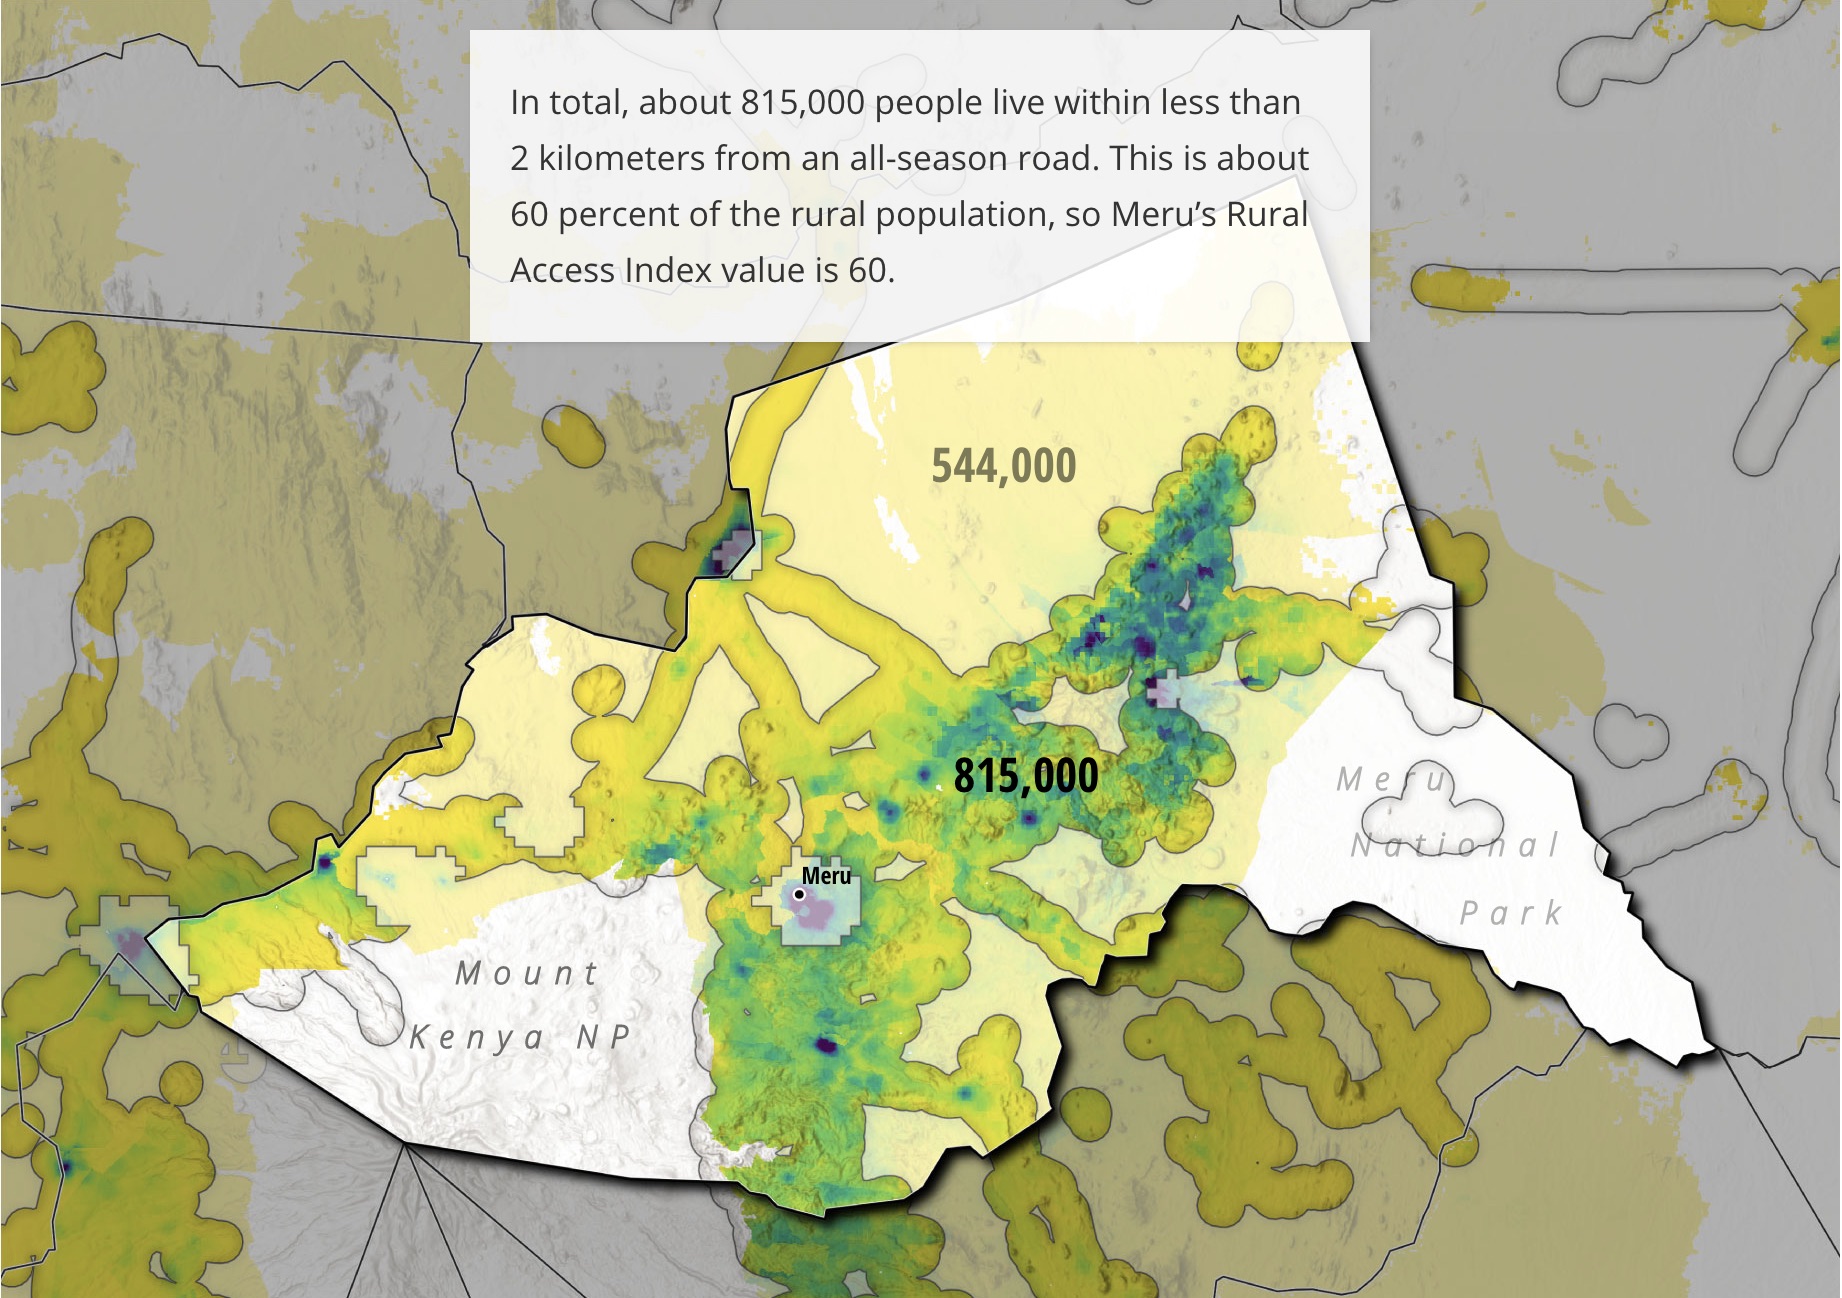
- Goal 9: Industry, innovation and infrastructure
- Goal 11: Sustainable cities and communities
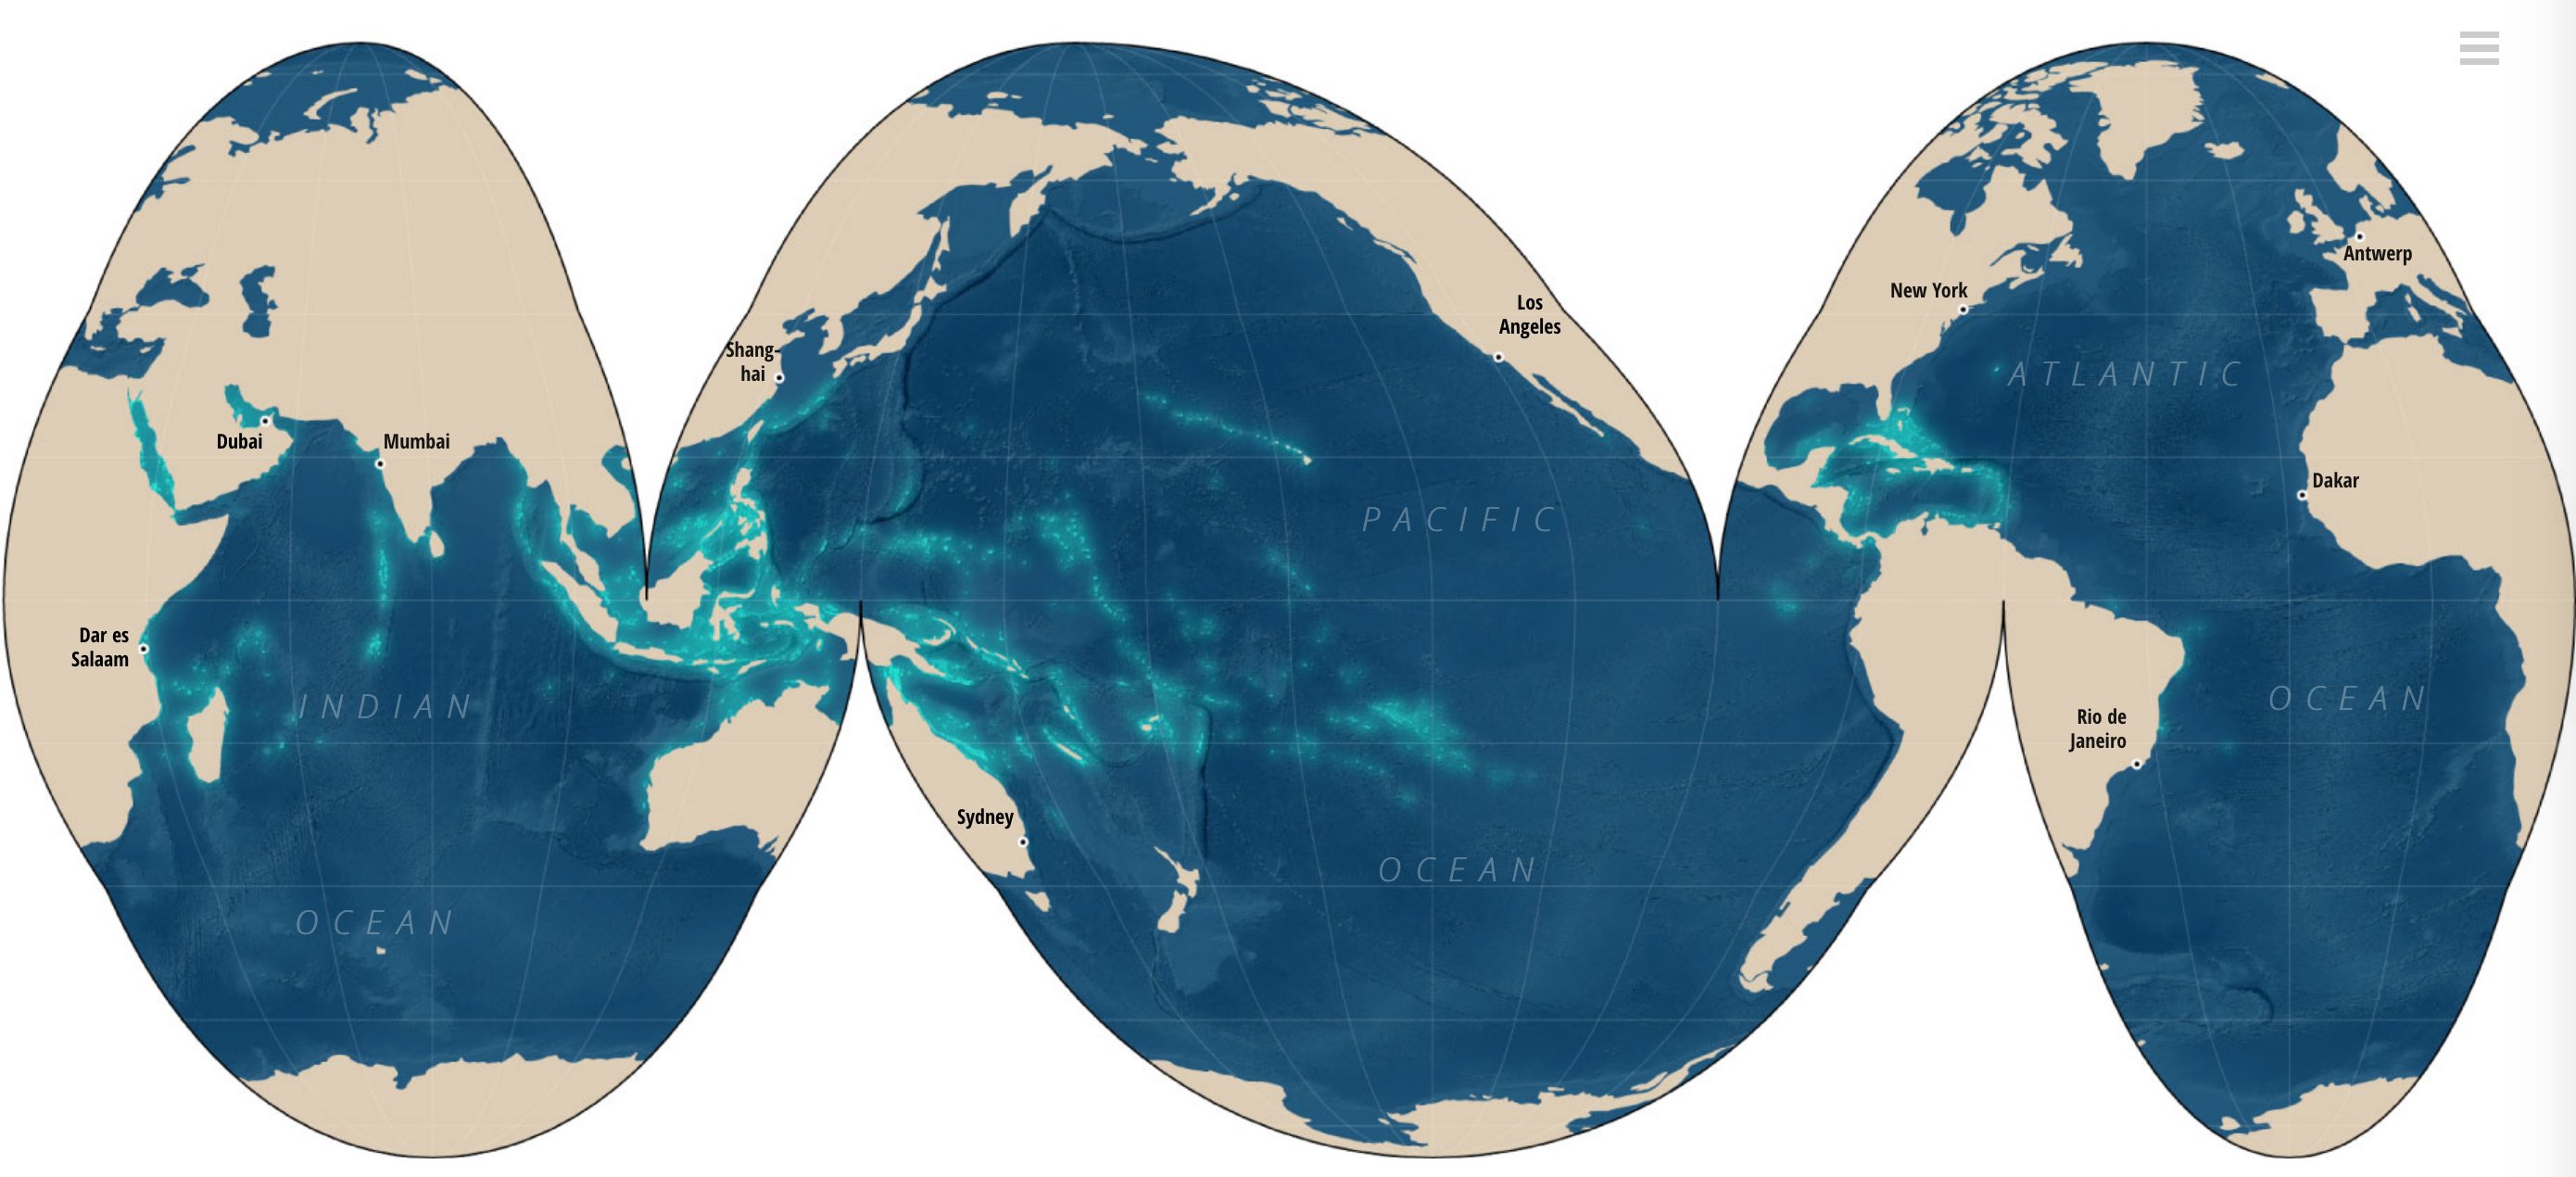
- Goal 14: Life below water
Highlights
I summarized the Atlas in this Twitter thread. Some of my personal highlights:
A shifted Marimekko chart, showing the distribution of learning poverty across regions in Goal 4: Quality education
A spinning and interactive globe to show differences in night lights seen from space, as a proxy for connectivity to the electrical grid. You can search and compare the nightlights of 6477 cities. I developed this together with Andrew Whitby for Goal 7: Affordable and clean energy.
In chapter 9, I explain how the Rural Access Index is calculated, by showing a sequence of maps that illustrate the geoprocessing steps of the calculation methodology.
For Goal 14: Life below water I made some global maps, with an ocean-centric projection.
Process and technology
I was invited to share our experience developing the Atlas with the World Bank Data Lab. Below you can find the slides I used to present our process and the technology behind the 17 stories.