Finally some charts of daily Belgian weather observations
April 20, 2020
The last couple of years have seen some nice efforts by the governments in Belgium (we have 6, don’t ask) to open up data. But not all have followed suit, and one of the institutions I have been especially frustrated with is our Royal Meteorological Institute.
While in other countries weather observation data is published as open data, our met office is still selling much of its data instead of just releasing it to the public. I did have some good experiences with employees replying positively to my data requests in the past. But I still don’t understand why we Belgians do not simply get access to this (in times of climate change) crucial data, which we paid taxes for in the first place.
Apparently, a law dating back to 1913 states that the met office should generate its income from selling its data, instead of releasing it. How a law like that is still not been revised in 2020 is totally beyond me: historical observations are crucial for people to understand how their environment is changing at a rapid pace, so these should be available to anyone.
So I had been wanting to do something with daily temperature observation in my country for a long time. But I just didn’t have the data. But then I learned about The Global Historical Climatology Network (GHCN), which is “an integrated database of climate summaries from land surface stations across the globe that have been subjected to a common suite of quality assurance reviews”. The GHCN Daily publishes daily observations for more than 100.000 weather stations globally.
And, yes, it includes data for Belgian weather stations. I searched for our main national station located at Uccle, near Brussels, and noticed that daily min, max and average temperature are available, since measurements began in 1833! You can also get daily precipitation and snow depth, if you want.
So now I not only know what the weather was like on the day I was born (looks like it was a typical Belgian end-of-winter day), but I could finally make some visualisations I have been wanting to make for a long time.
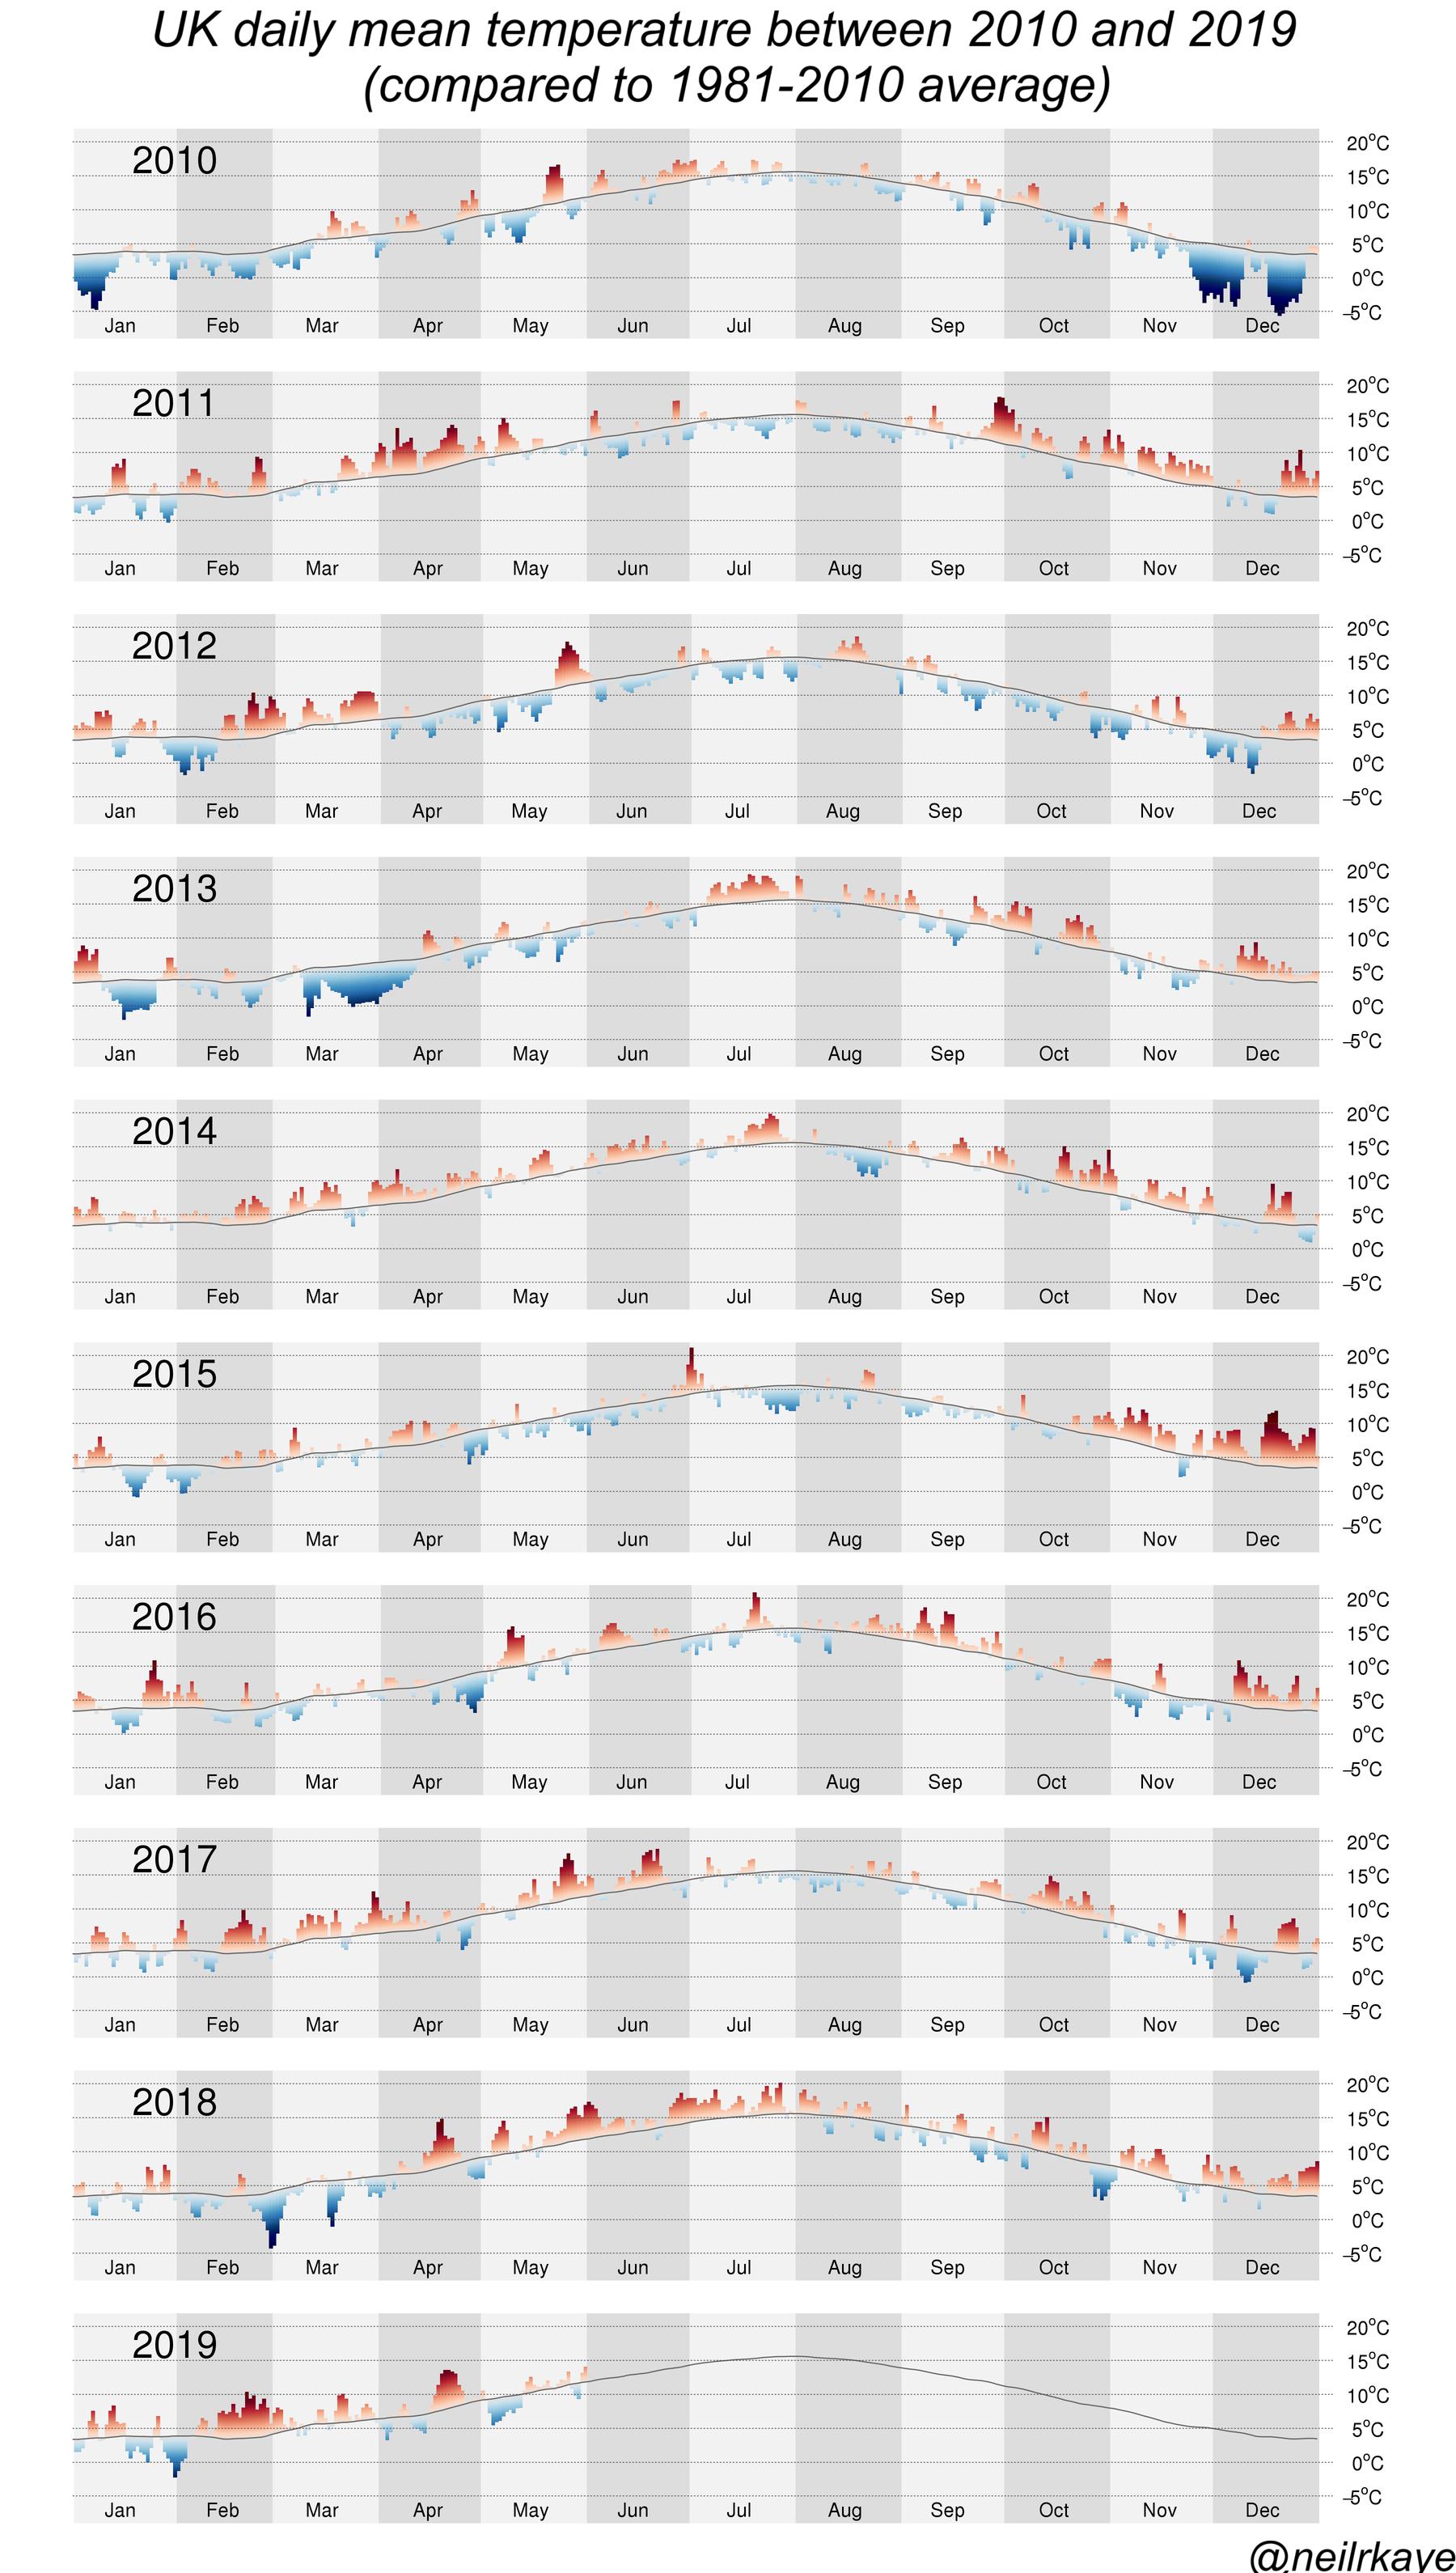
My main inspiration for the chart I made was Neil Kaye of the UK Met Office, who has been making some excellent climate and weather graphics over the last couple of years. This is one of his charts that I especially liked:
At the same time that I got my hands on the data some months ago, I also started writing R and ggplot2 tutorials for Flowing Data, and Neil’s plot and my newly acquired data were a perfect match for a new tutorial (sorry, paywall). This is the result:
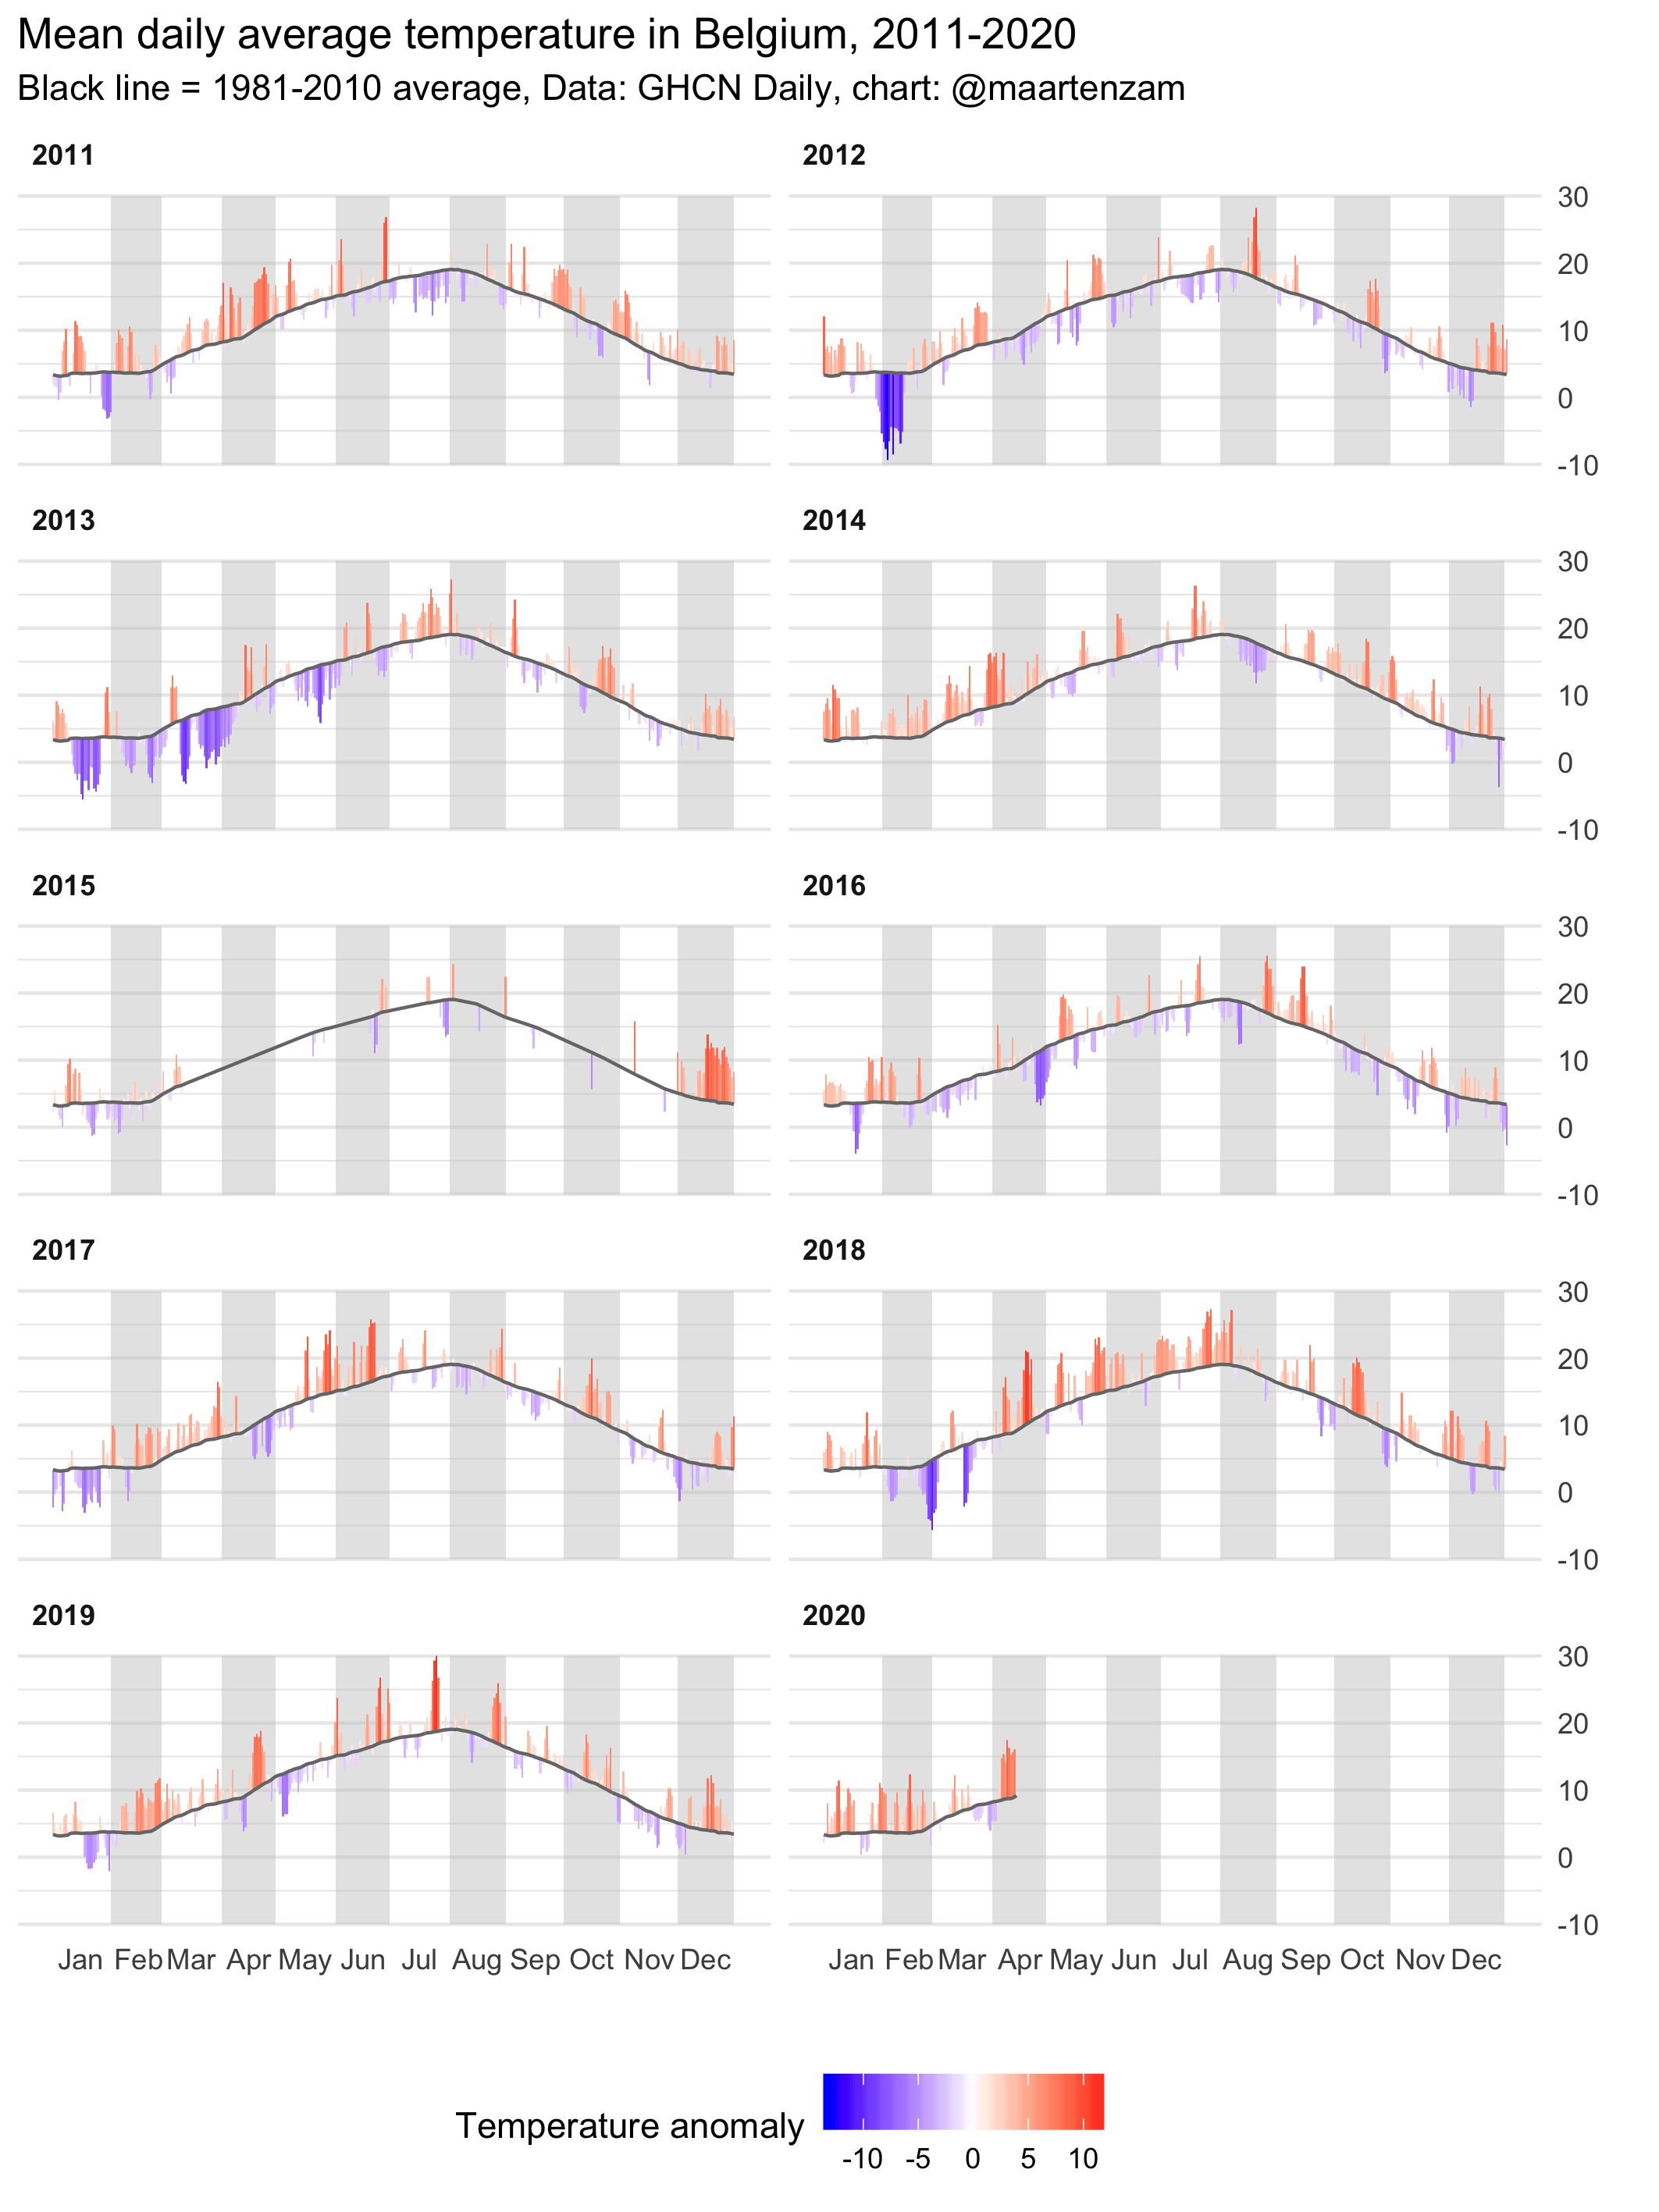
It’s easy to spot the extreme spells in these charts, like the cold in February 2012 (with snow cover for 2 weeks), the incredibly warm December 2015, and the horror heat of last summer, shattering all records.
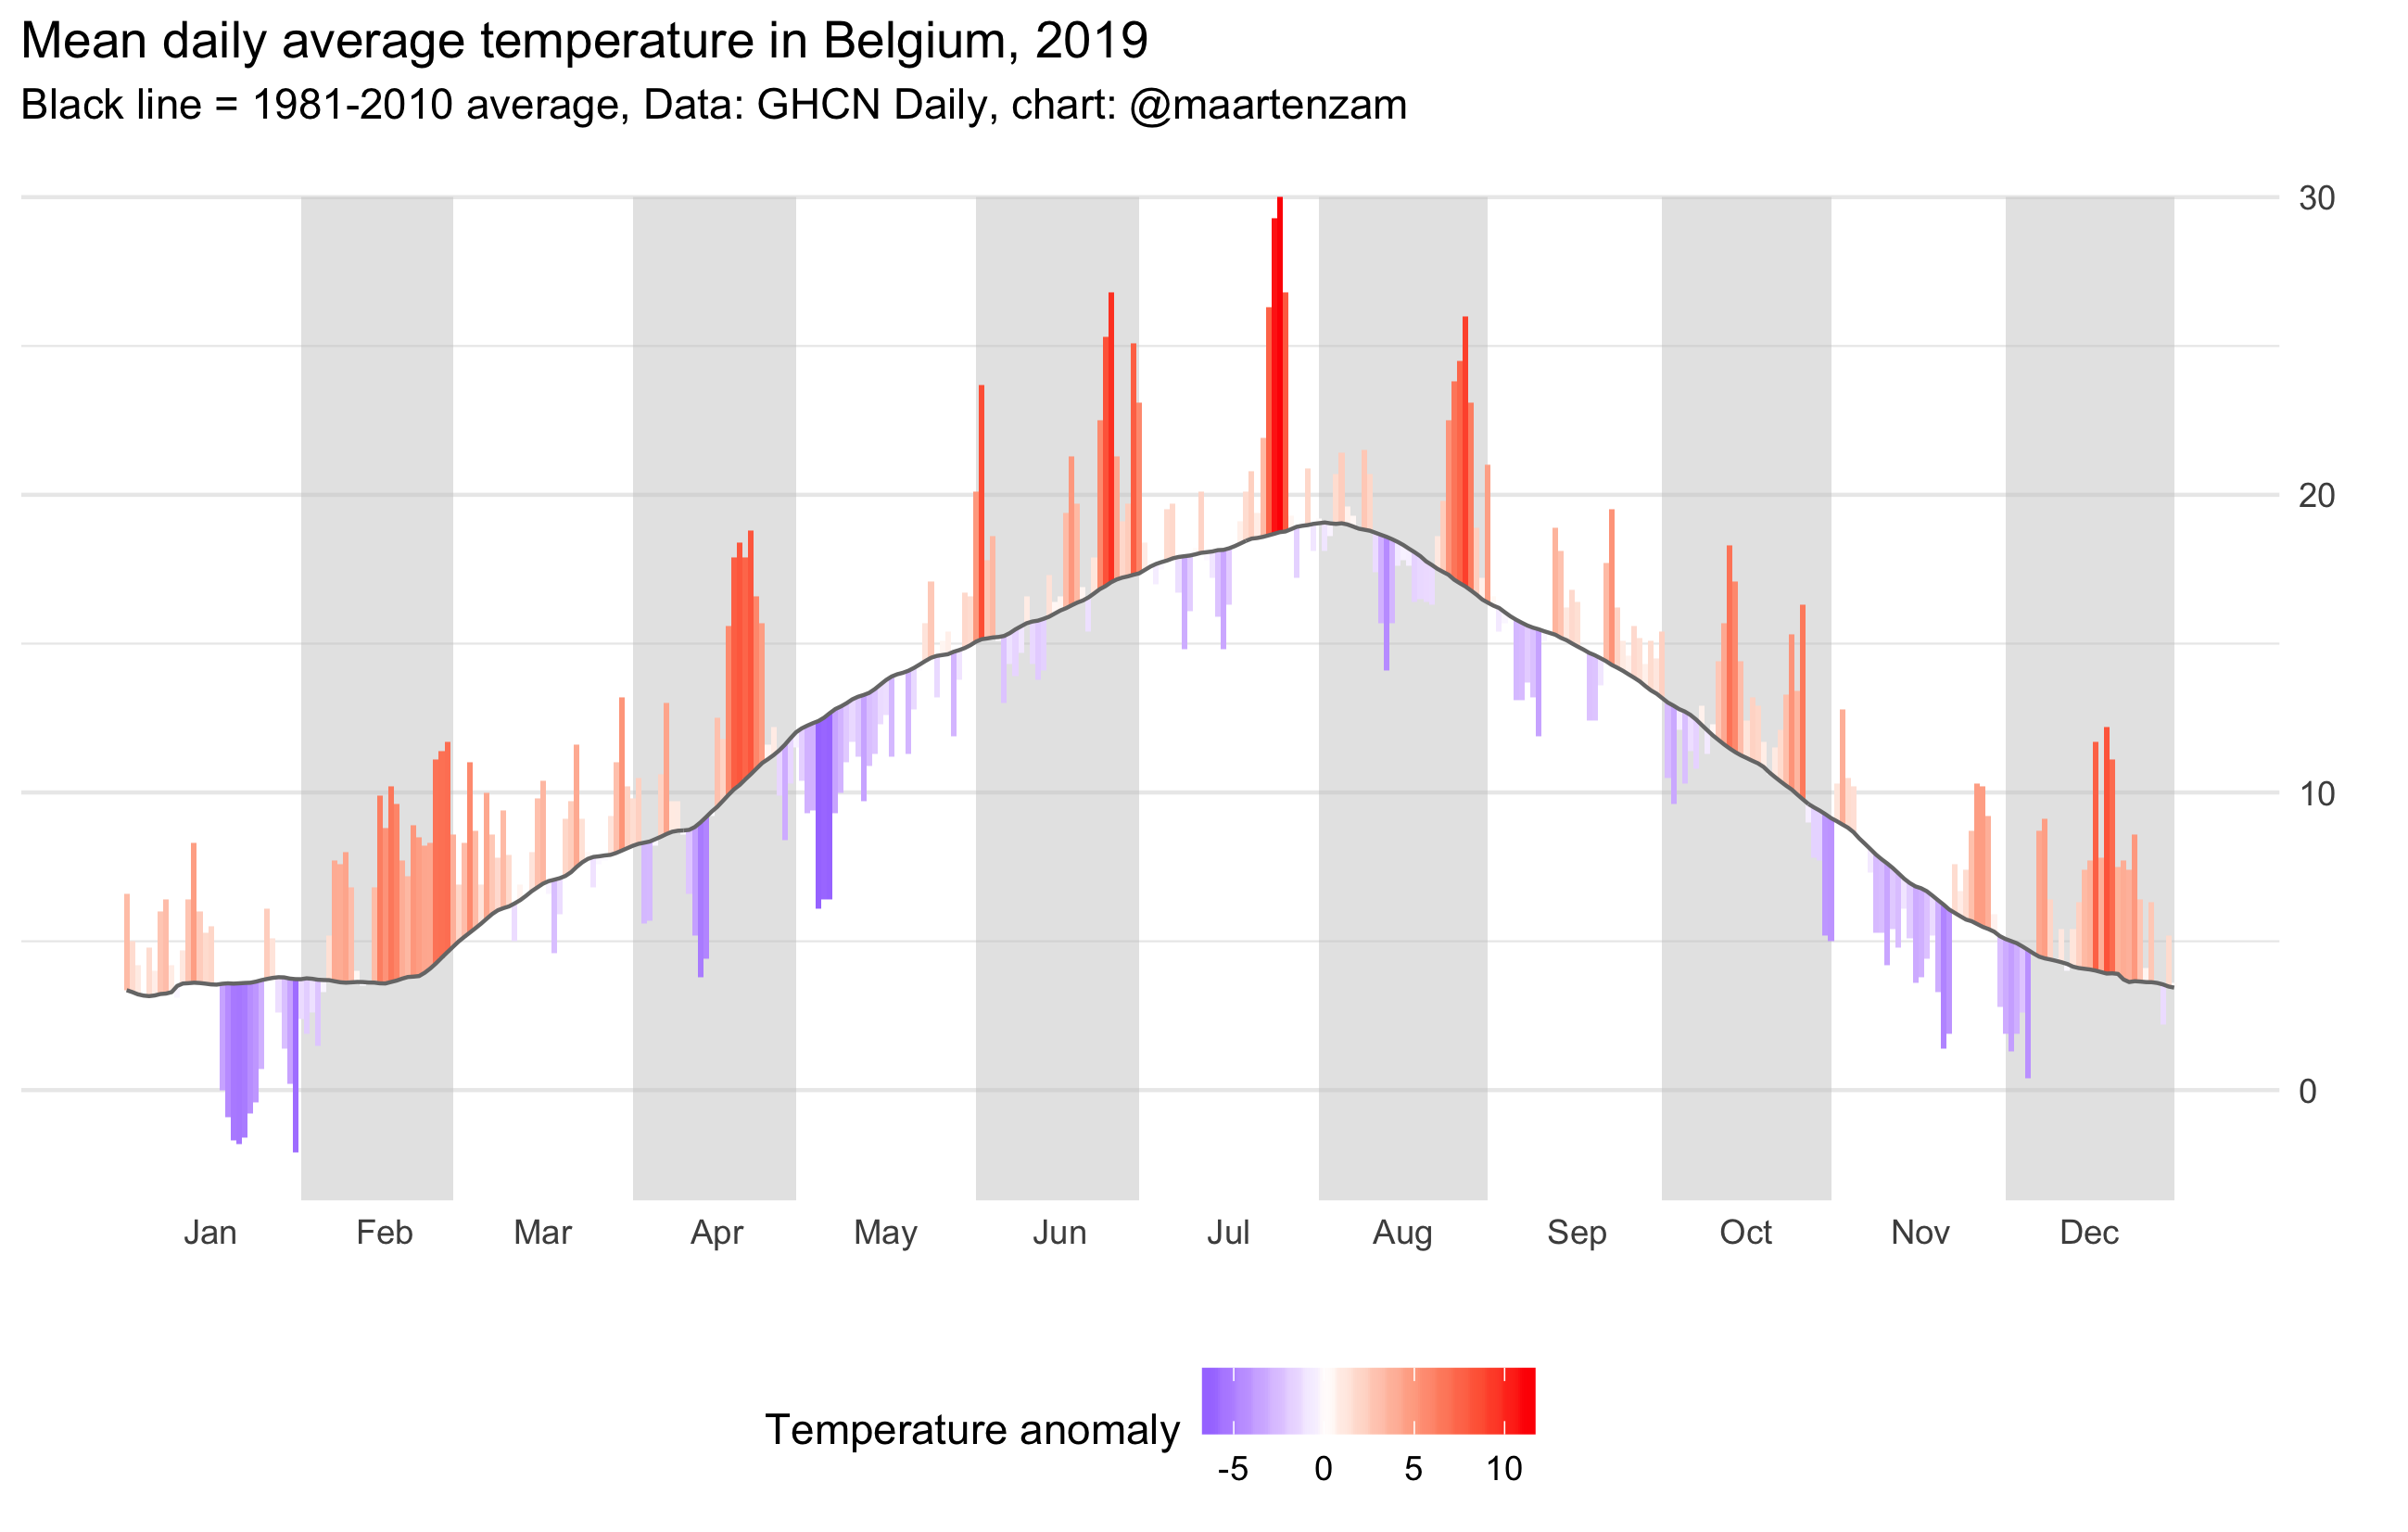
This was last year:
And this is 2020 so far:
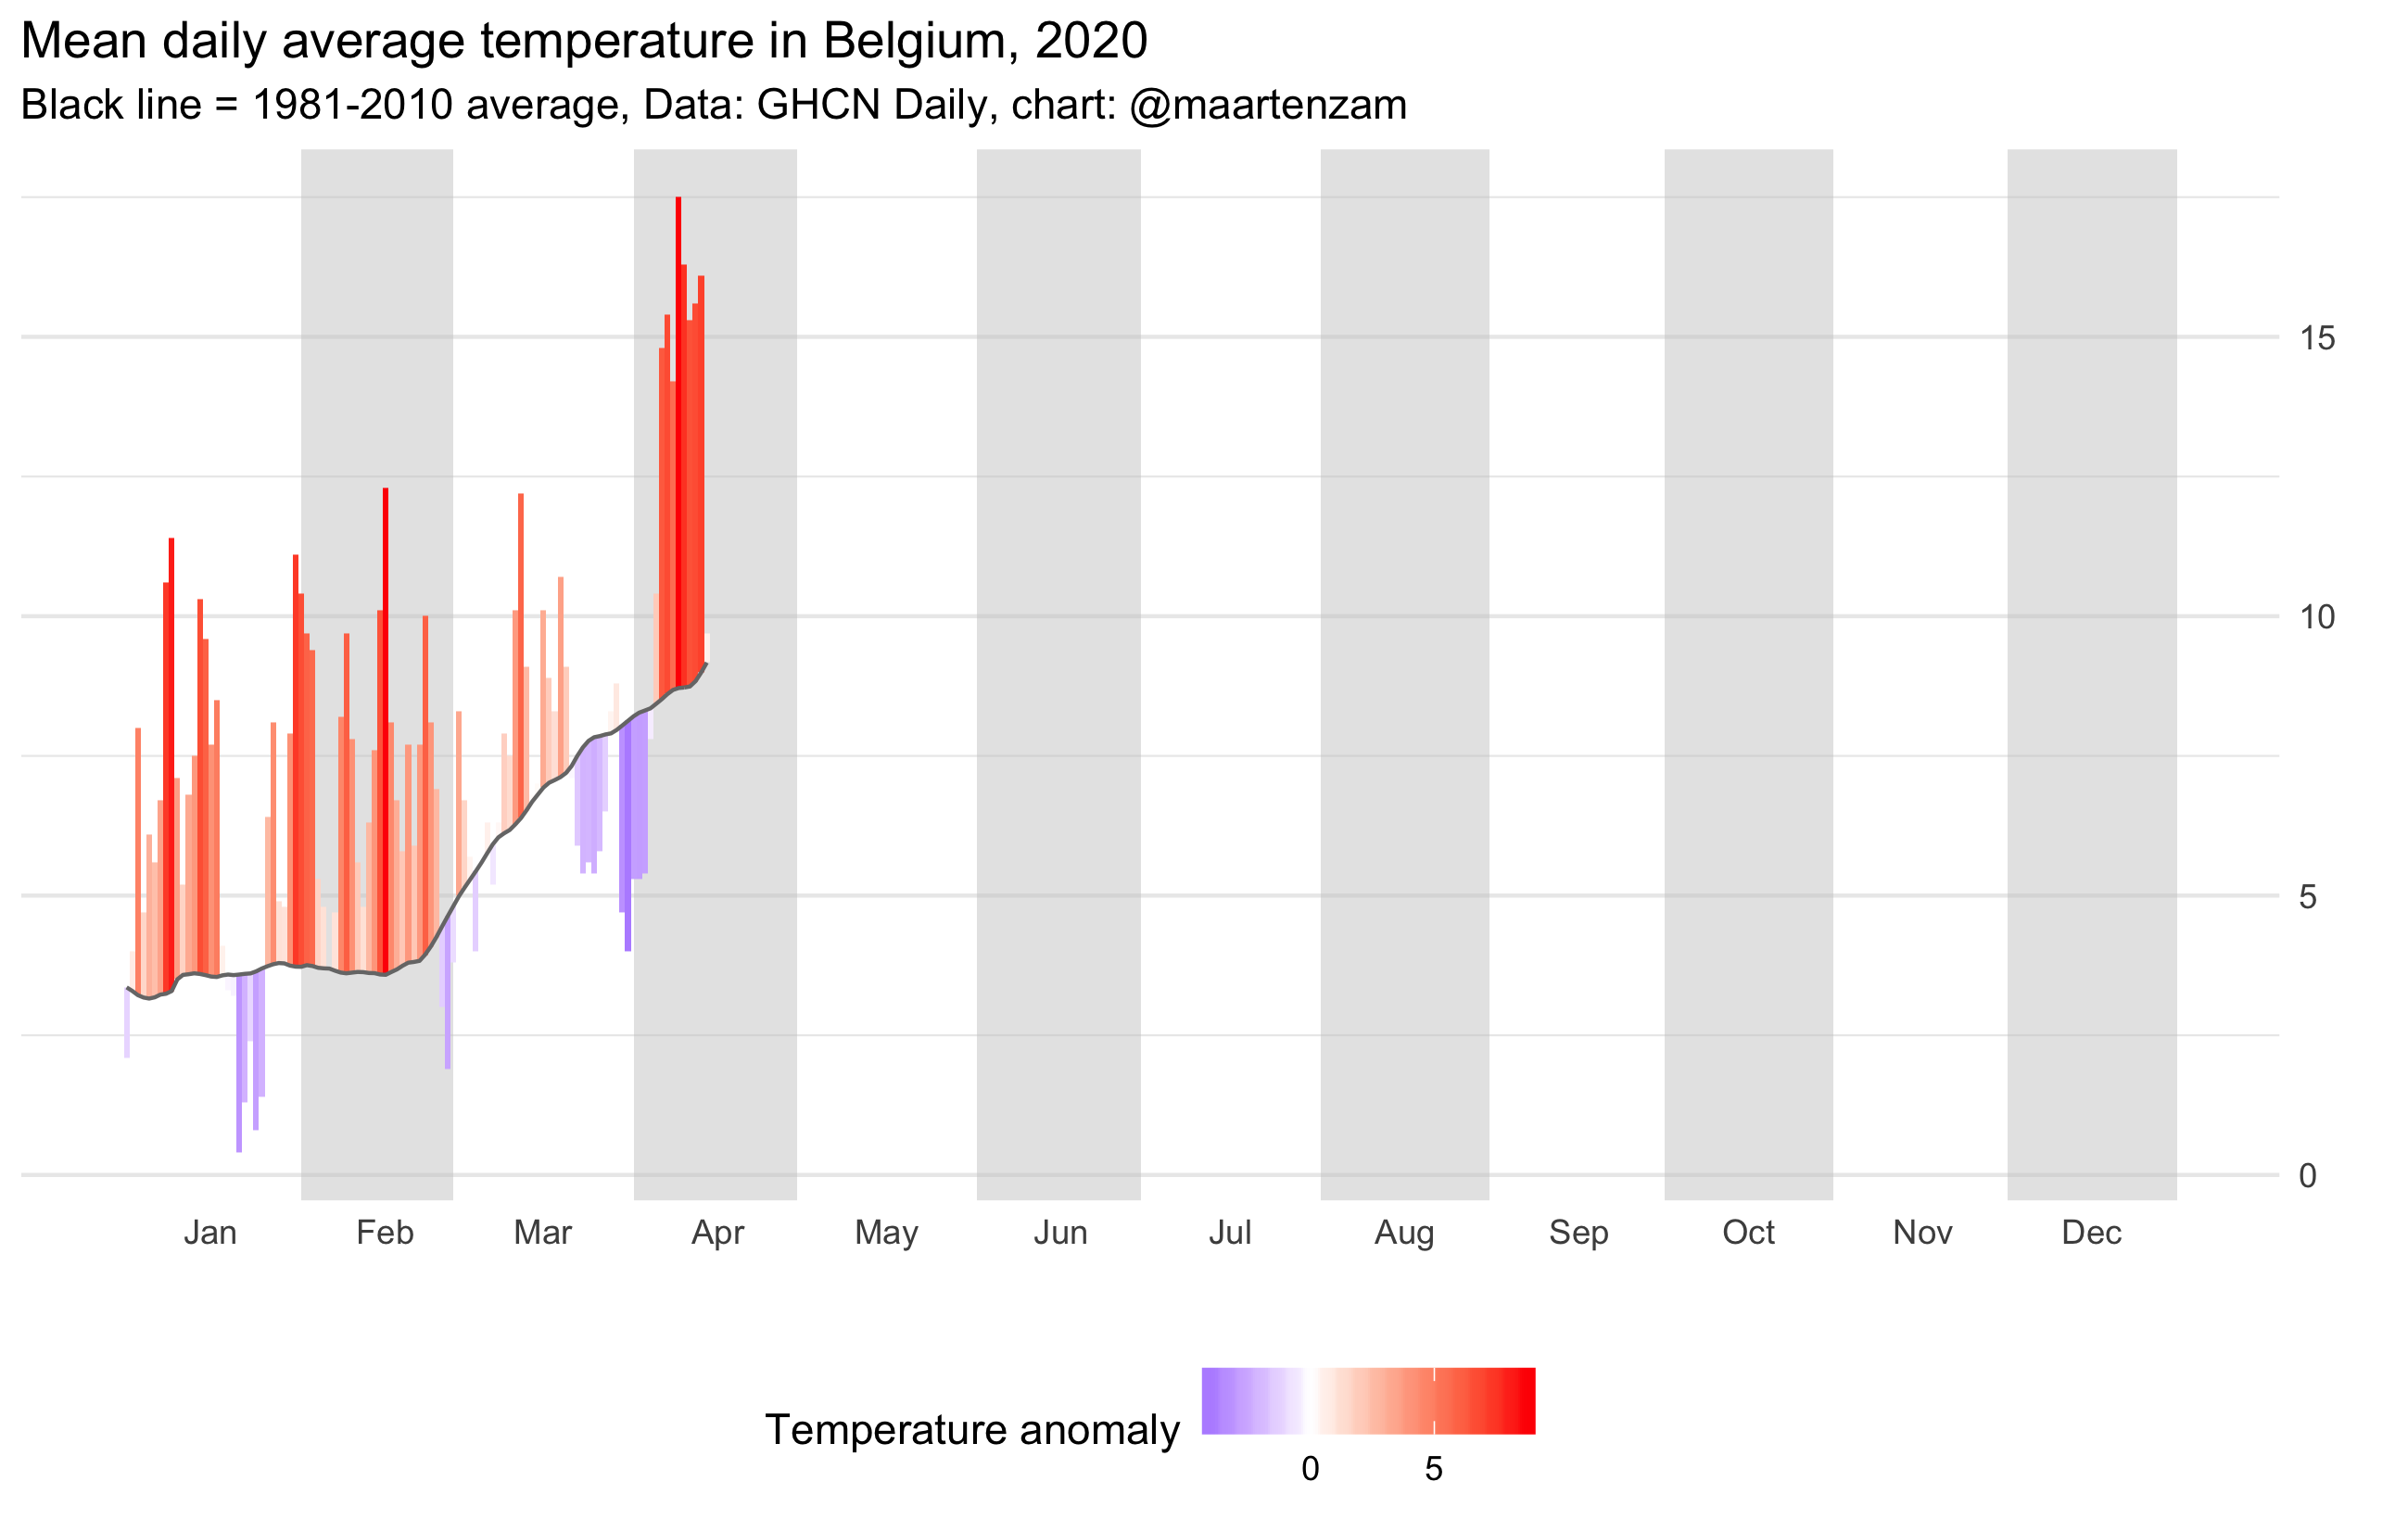
The virus is pushing this to the background a little bit, but this spring is already very warm. For the first time in my life, I am not looking forward to the summer. But at least I have some daily observation data to play with now. I’m planning to do something with the precipitation data next.