Served
Clients & Testimonials
I have given trainings, workshops and keynotes on data journalism and data visualization for a large variety of audiences. My work is featured in some of the reference books in the field of data visualization. Some of my work got shortlisted in visualization competitions and I have even won some awards.
Some of the clients I worked with include:
Speaker and judge
Malofiej 24 judge and speaker
I was among the judges and speakers at the 24th Malofiej Infographic World Summit. I launched Rock 'n Poll on the occasion. My keynote was described by Alberto Cairo as 'one of the most relevant talks ever in the summit'.
At #malofiej24, @maartenzam just did one of the most relevant talks ever in the summit: We designers/Journalists need to learn about stats
— Alberto Cairo (@albertocairo) March 10, 2016
Visualizing Knowledge keynote speaker
I was invited to the Visualizing Knowledge conference in Helsinki, Finland. I took the occasion to speak about Explorable Explanations, powerfull interactives for explaining complex processes and systems. I also manage @explorables.
Neat explanatory interactive on interpreting polls by @maartenzam #VisualizingKnowledge https://t.co/GaMrwQy7Kg
— Jen Christiansen (@ChristiansenJen) September 9, 2016
Newspaper Awards
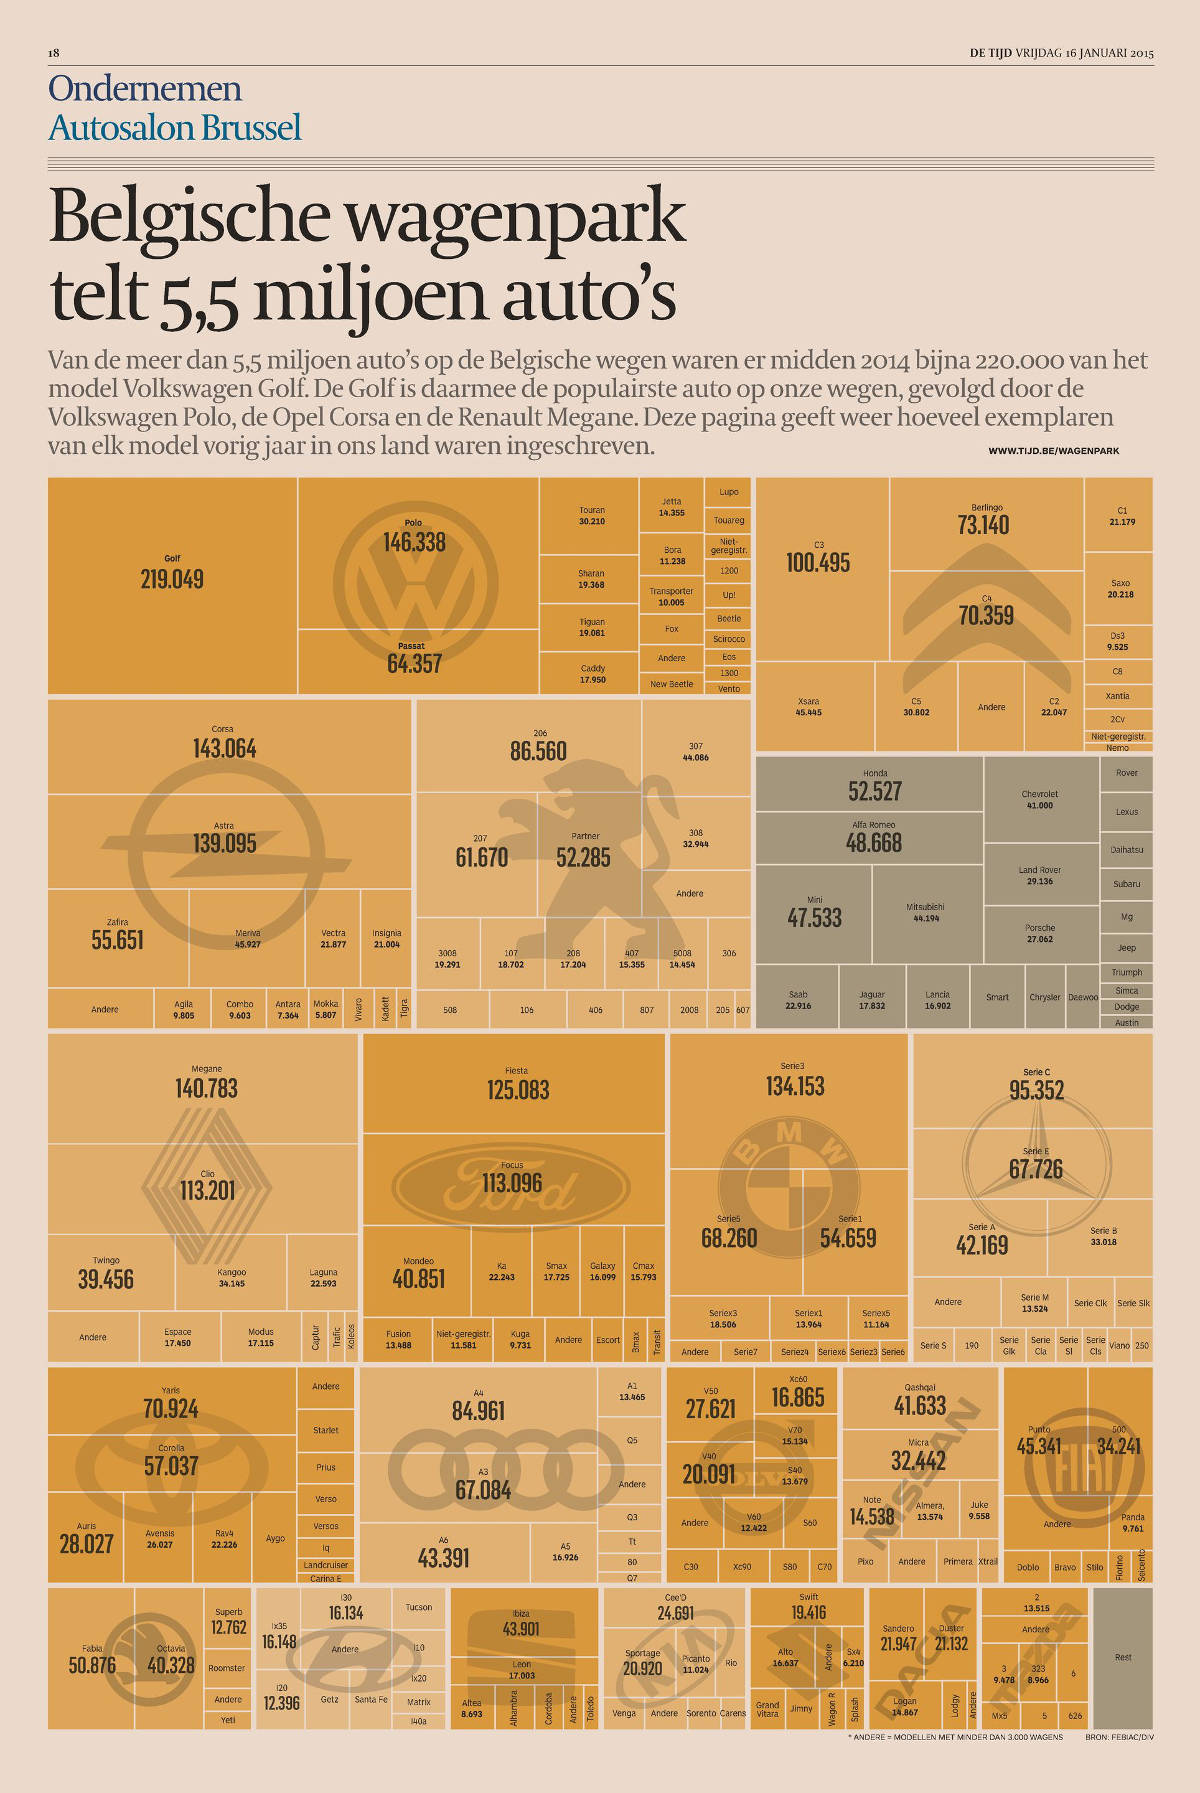
European Newspaper Design Award 2015
This page, containing a treemap of the composition of the Belgian car fleet designed by me, received a European Newspaper Design Award of Excellence.
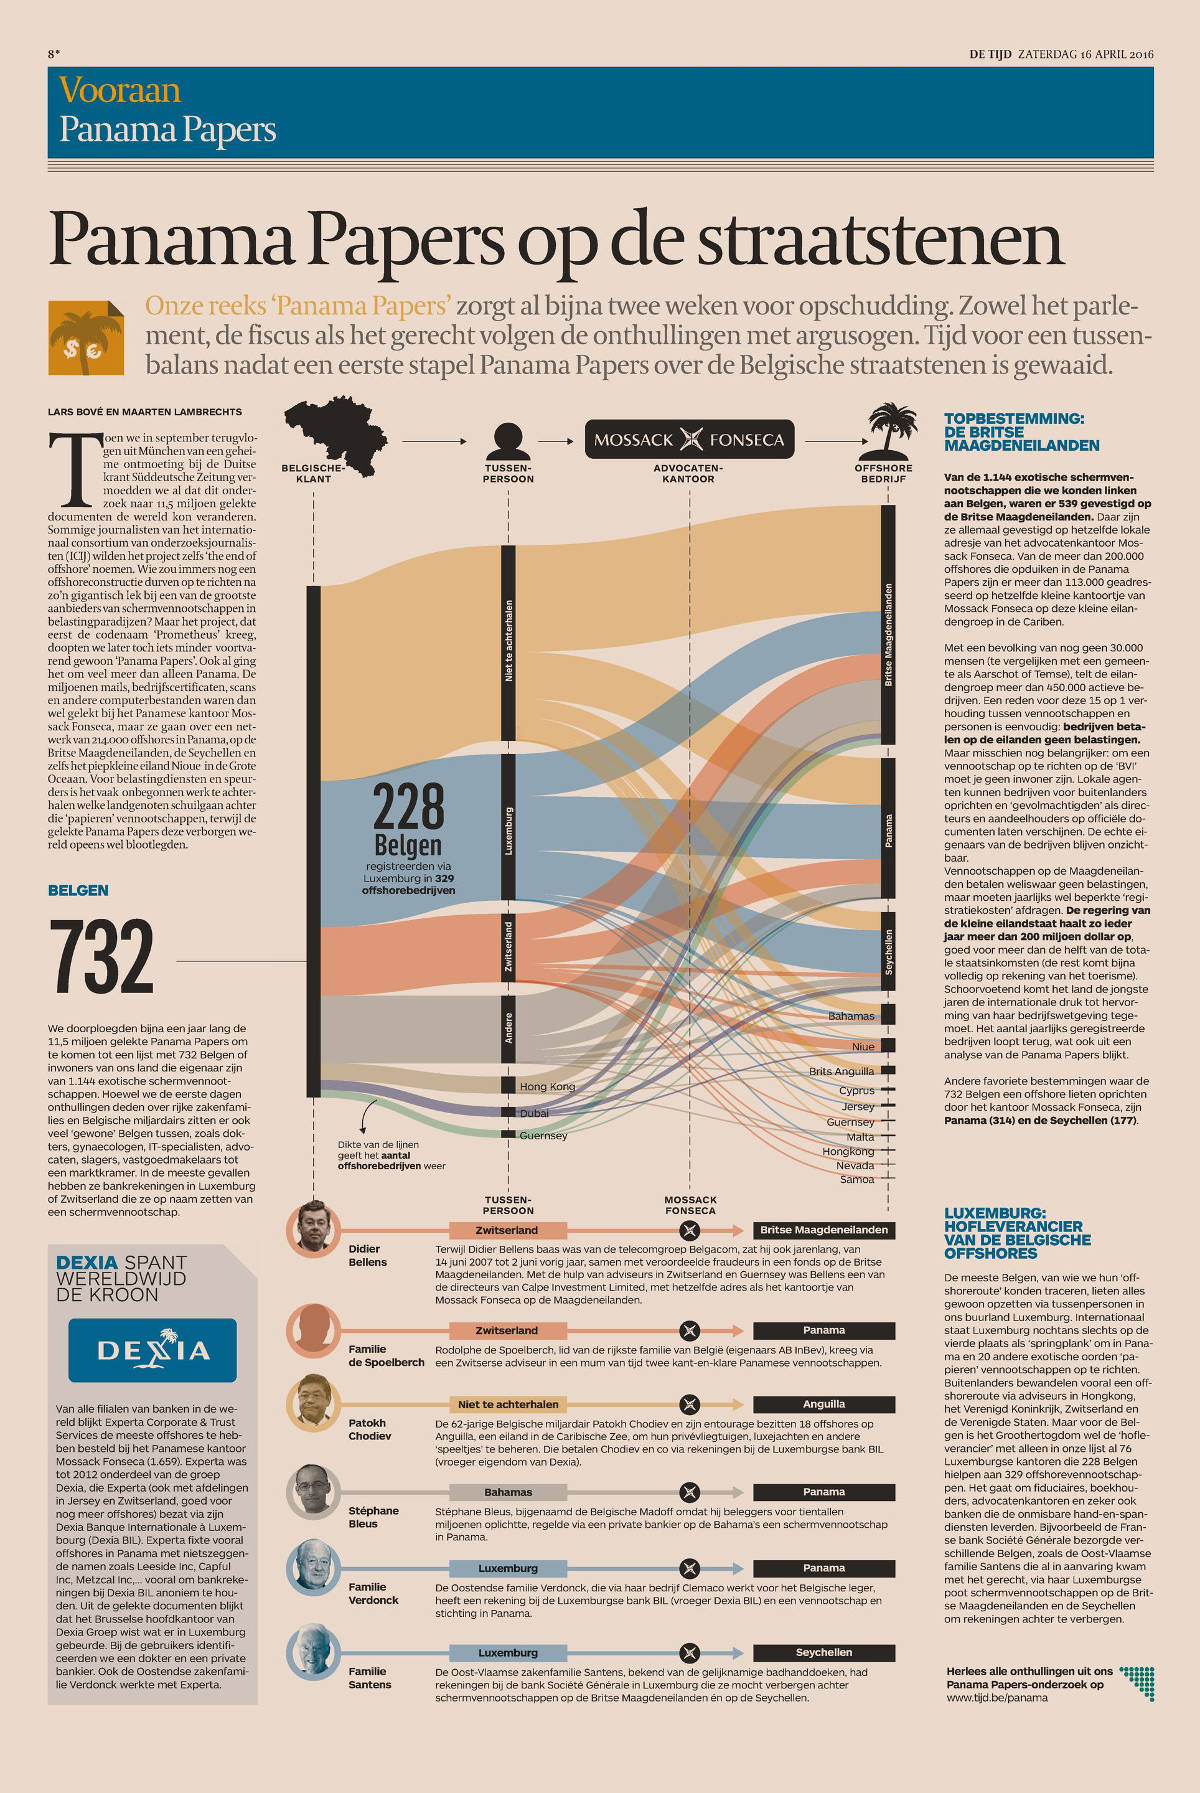
European Newspaper Design Award 2016
This page, containing Sankey diagram of Belgian people involved in the Panama Papers leak, also won a Europan Newspaper Design Award in 2016.
Trainings and workshops
Executive Master Class Creating Business Value with Big Data
"Very good balance between theory and concrete examples."
3 participants agree in their evaluation
Workshop Datavisualization: The Basics
"Very good content-wise, many new insights were brought, some “trivial” information was given as well but it is always good to hear this explicitly by an expert."
Big Data Team member
Workshops Datavisualization, data communication & maps
Maarten put a lot of effort in addressing our own visualization issues and examples.
A participant, asked about the positive points of the workshop
Featured in books
The Truthfull Art
"Maarten Lambrechts embodies a trend I've observed in the past decade: an increasing number of people with backgrounds in technical and scientific fields (Maarten is an engineer) have finally understood that journalism isn't just what newspapers or news magazines of broadcast TV do."
Alberto Cairo
Data Visualisation: A Handbook for Data Driven Design
The 200+ Beer Brands of SAB InBev is featured in this book by Andy Kirk as an example of a dendrogram.
Awards & shortlists
Information is Beautiful and Data Journalism Awards Shortlists
How expensive is your neighborhood? was shorlisted for the Data Journalism Awards 2016 in the category 'News Data App of the Year', as was my portfolio in the 'Best individual portfolio' category.
Weather Browser was also shortlisted for the Information is Beautiful Awards 2015.

Runner up Climate Crush data visualization competition
My Weather Browser made it runner up in the Climate Crush visualization contest, organized by climate data company Weather Analytics.
Hire me
Just leave a message, email me or tweet me, I will get back to you as soon as possible.
Maarten Lambrechts
+32 488 242 996
Koningin Astridlaan 65
3290 Diest
Belgium