Written

Making-ofs, remakes & critiques

Moving on... is moving back!

Saying goodbye to freelancing

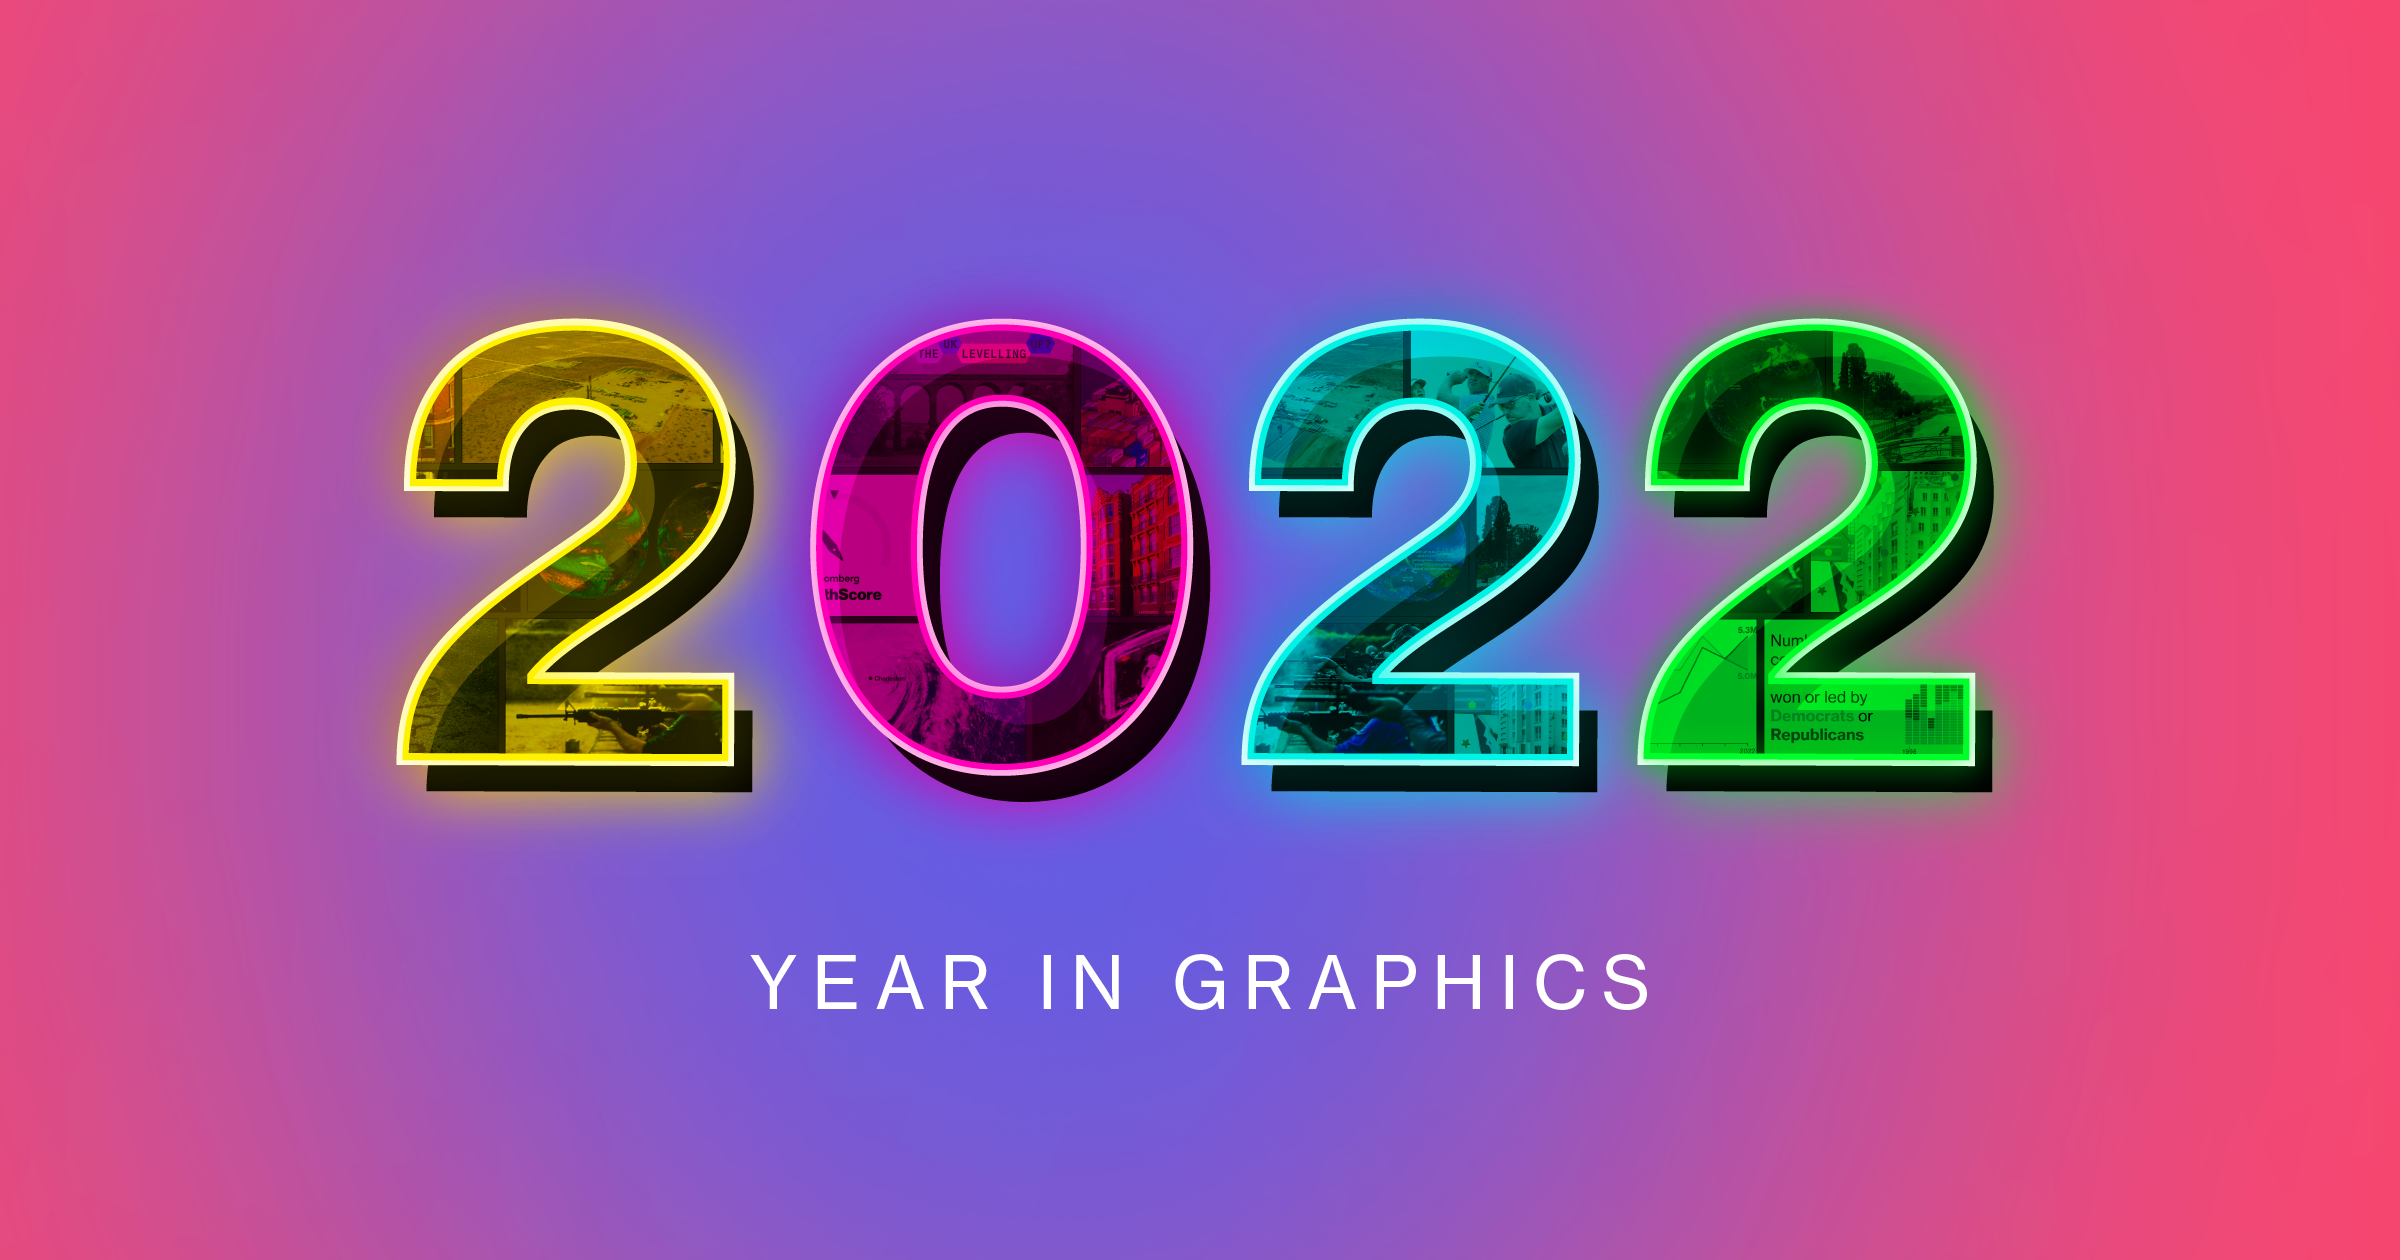
The list of 2022 visualization lists

The year in visual stories, graphics maps and satellite images

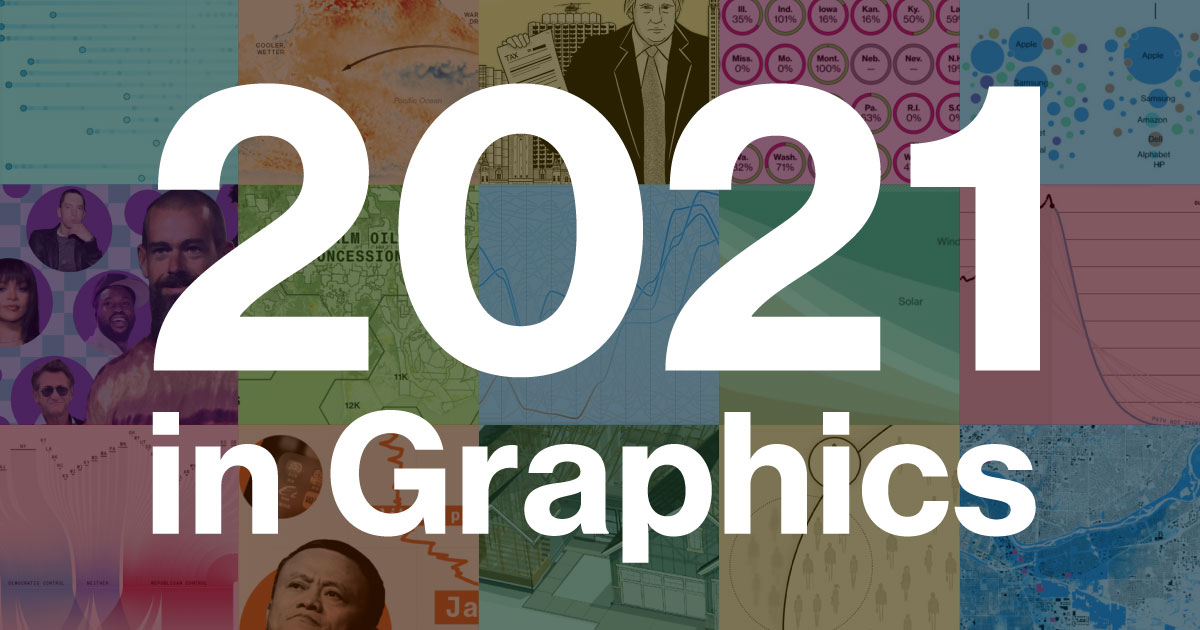
The list of 2021 visualization lists

The year in visual stories, graphics maps and satellite images

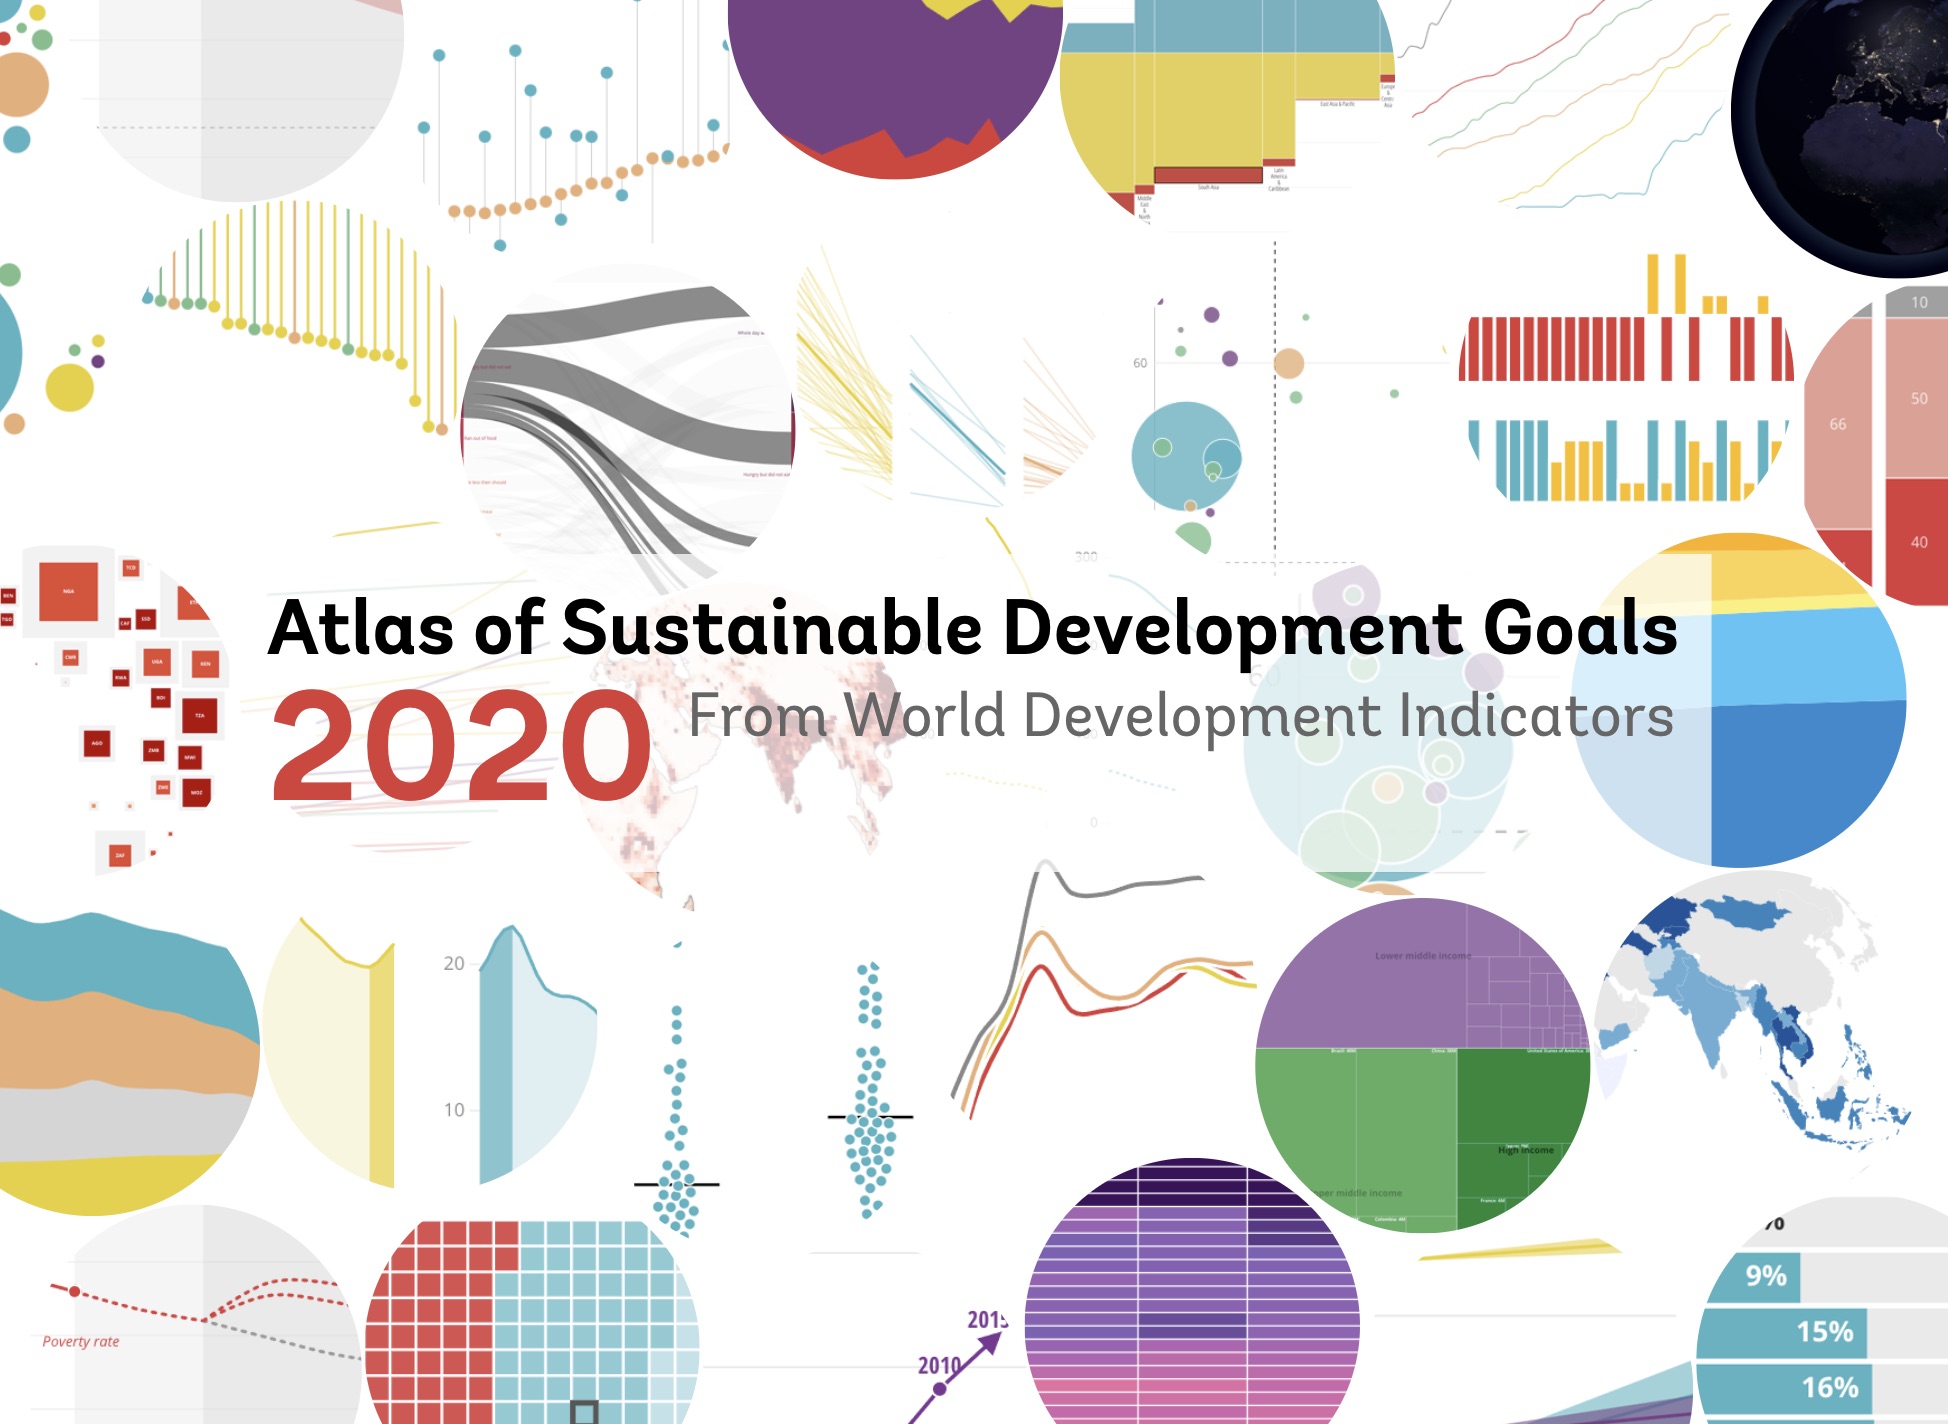
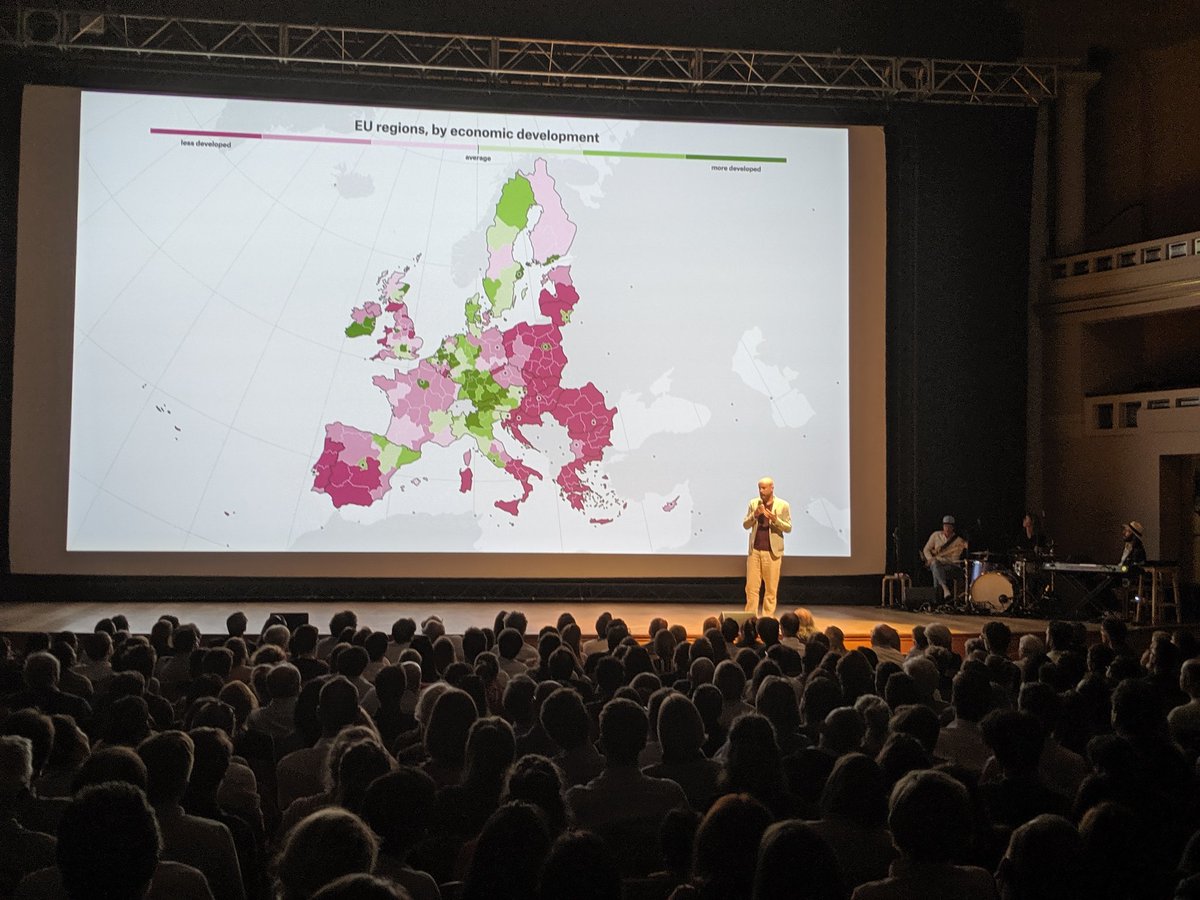
My contribution to the World Bank Sustainable Development Goals Atlas

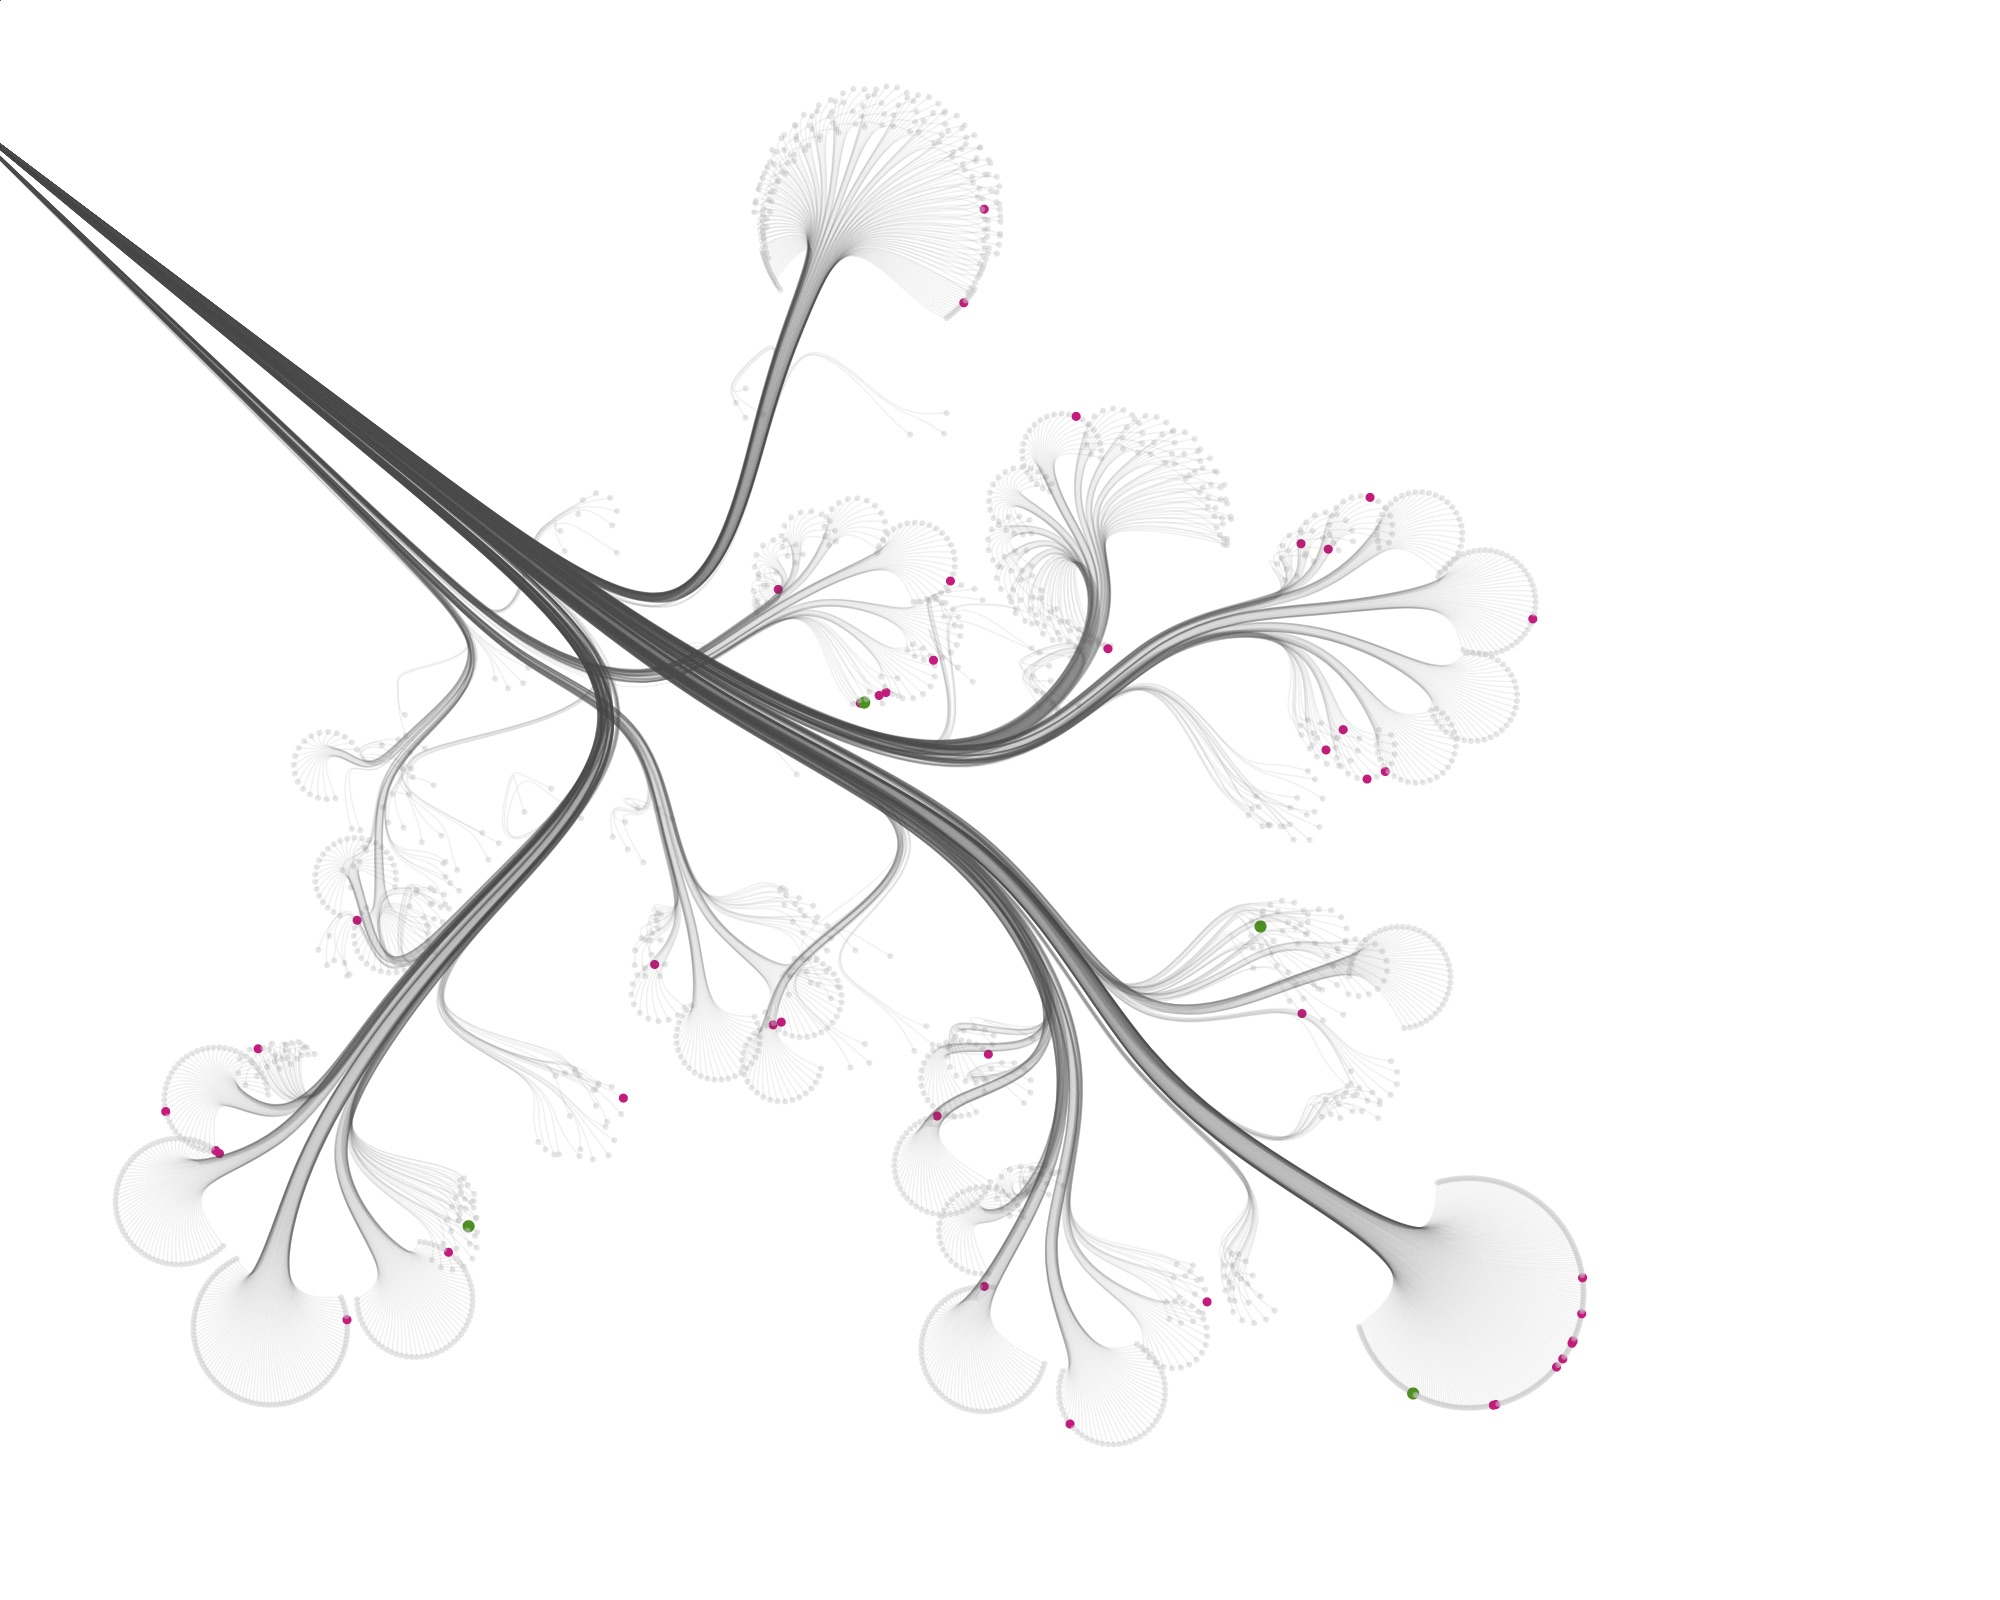
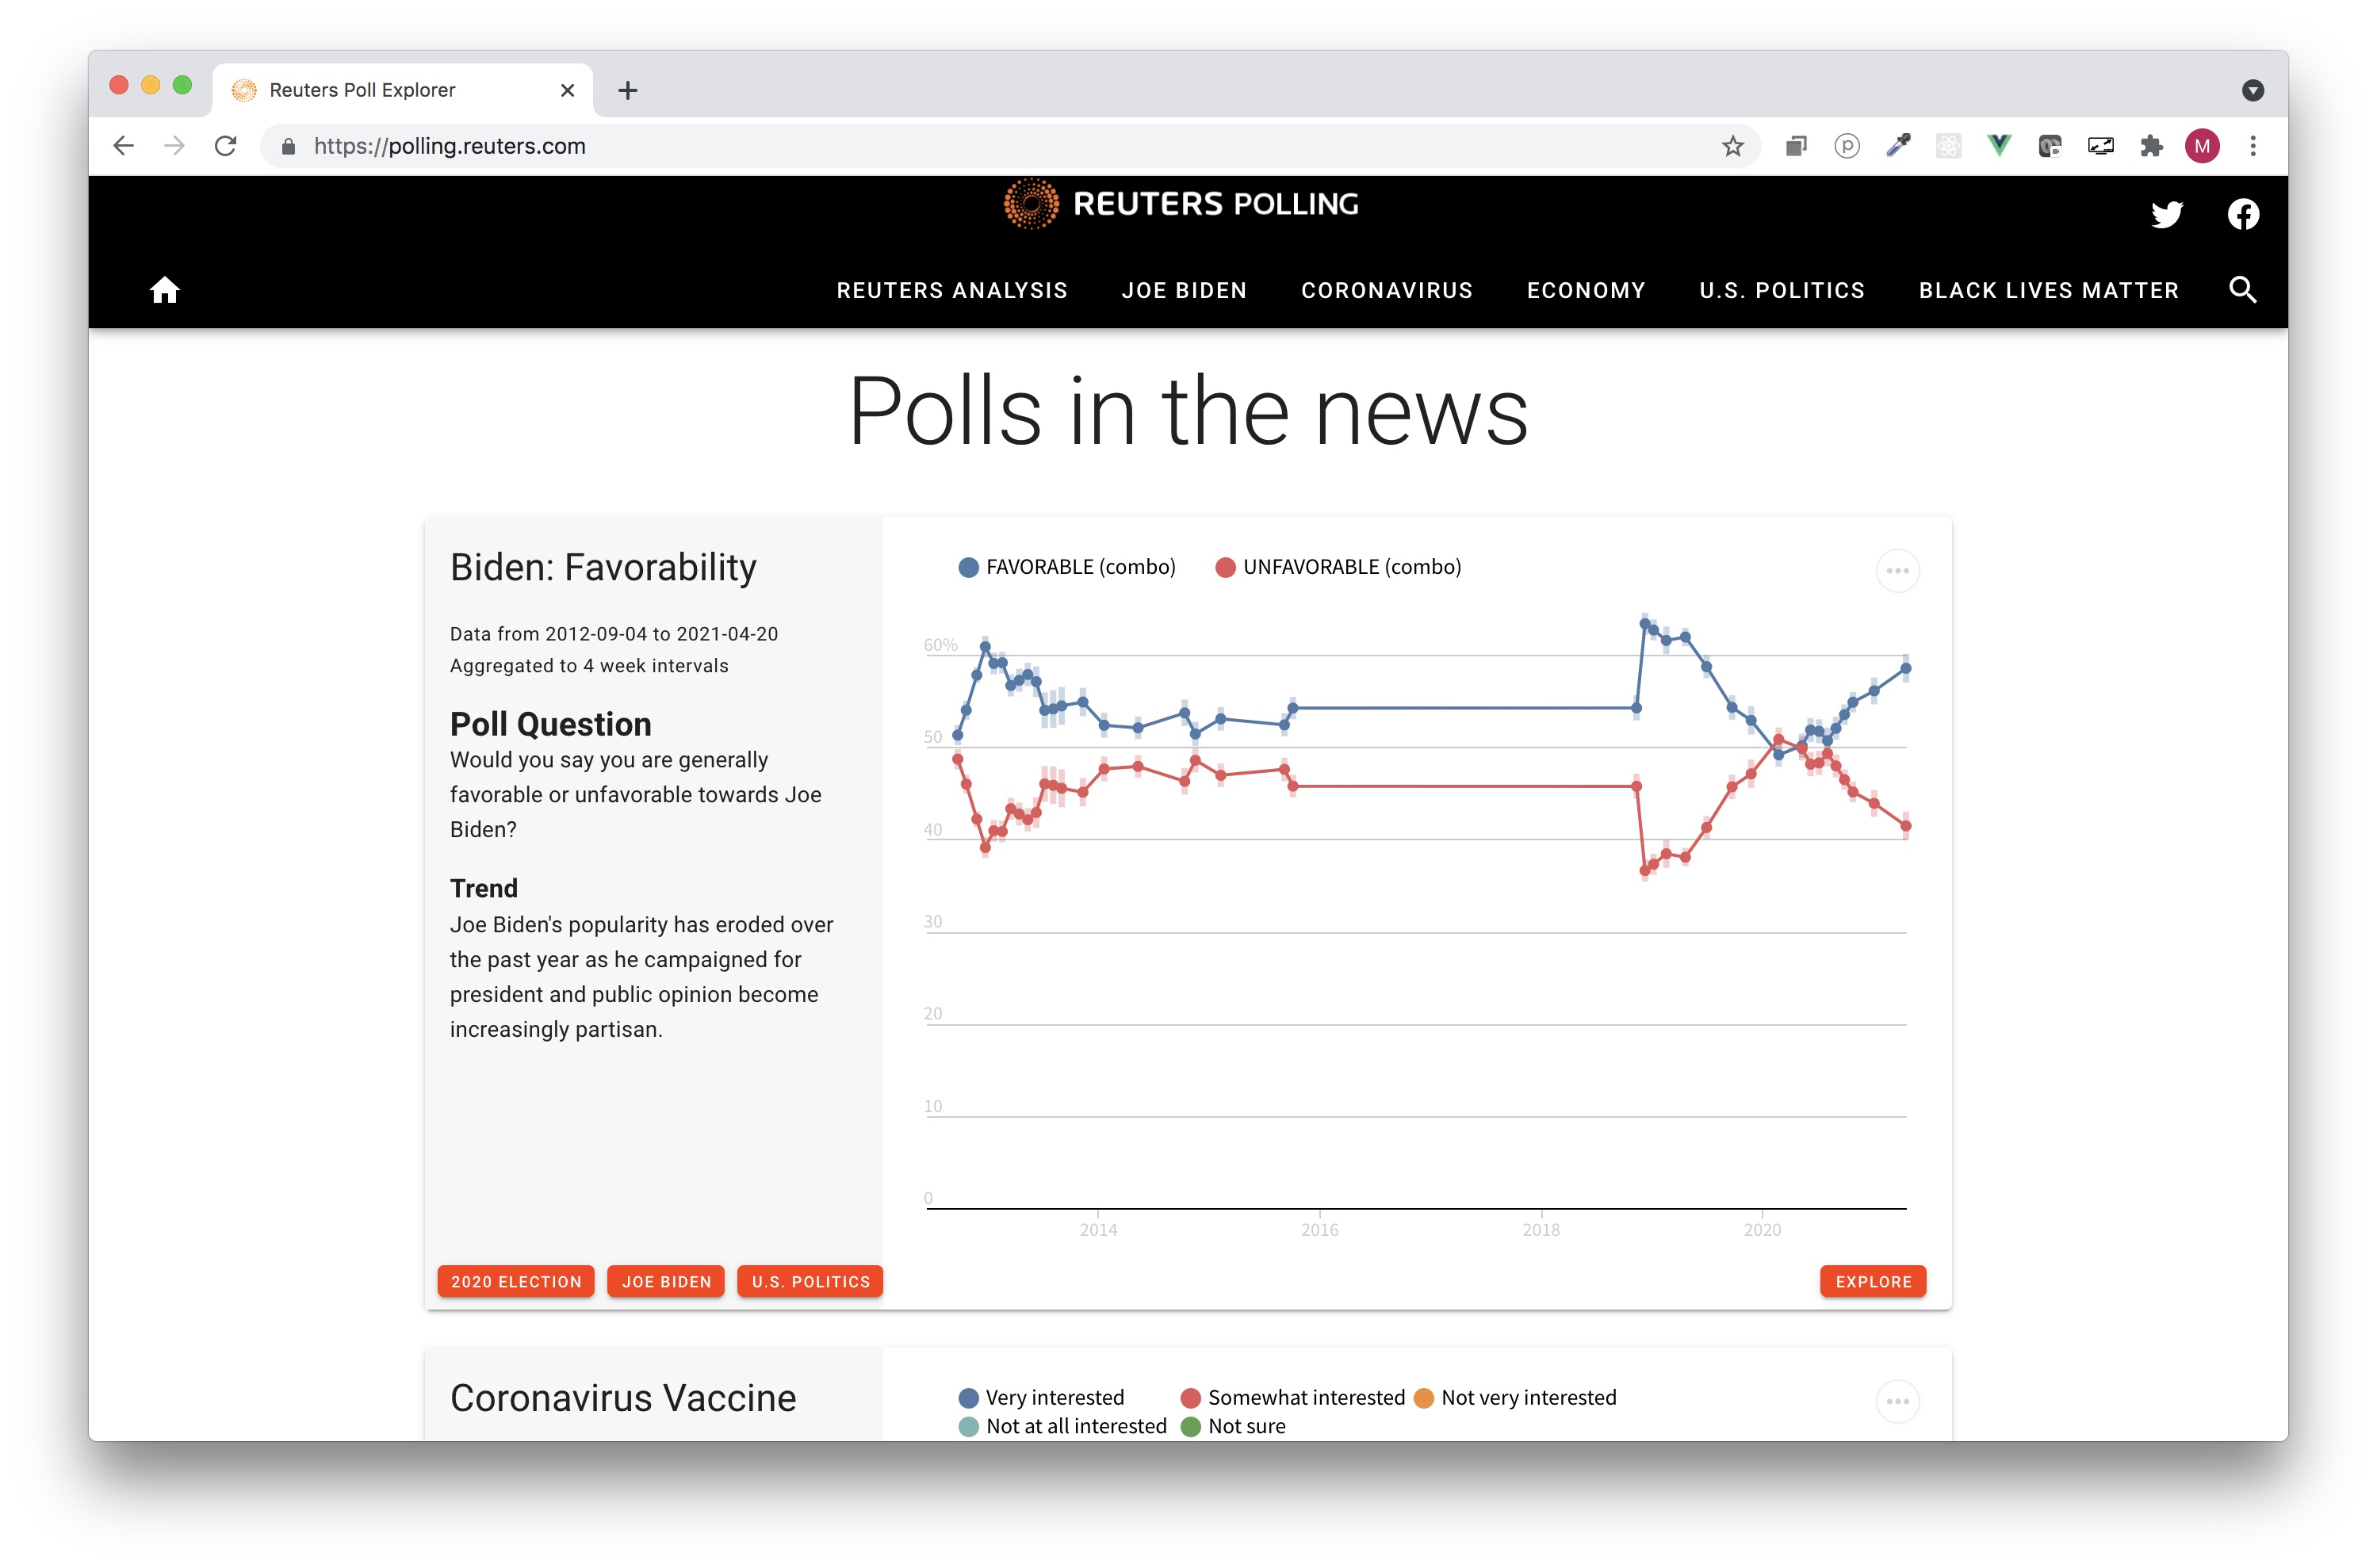
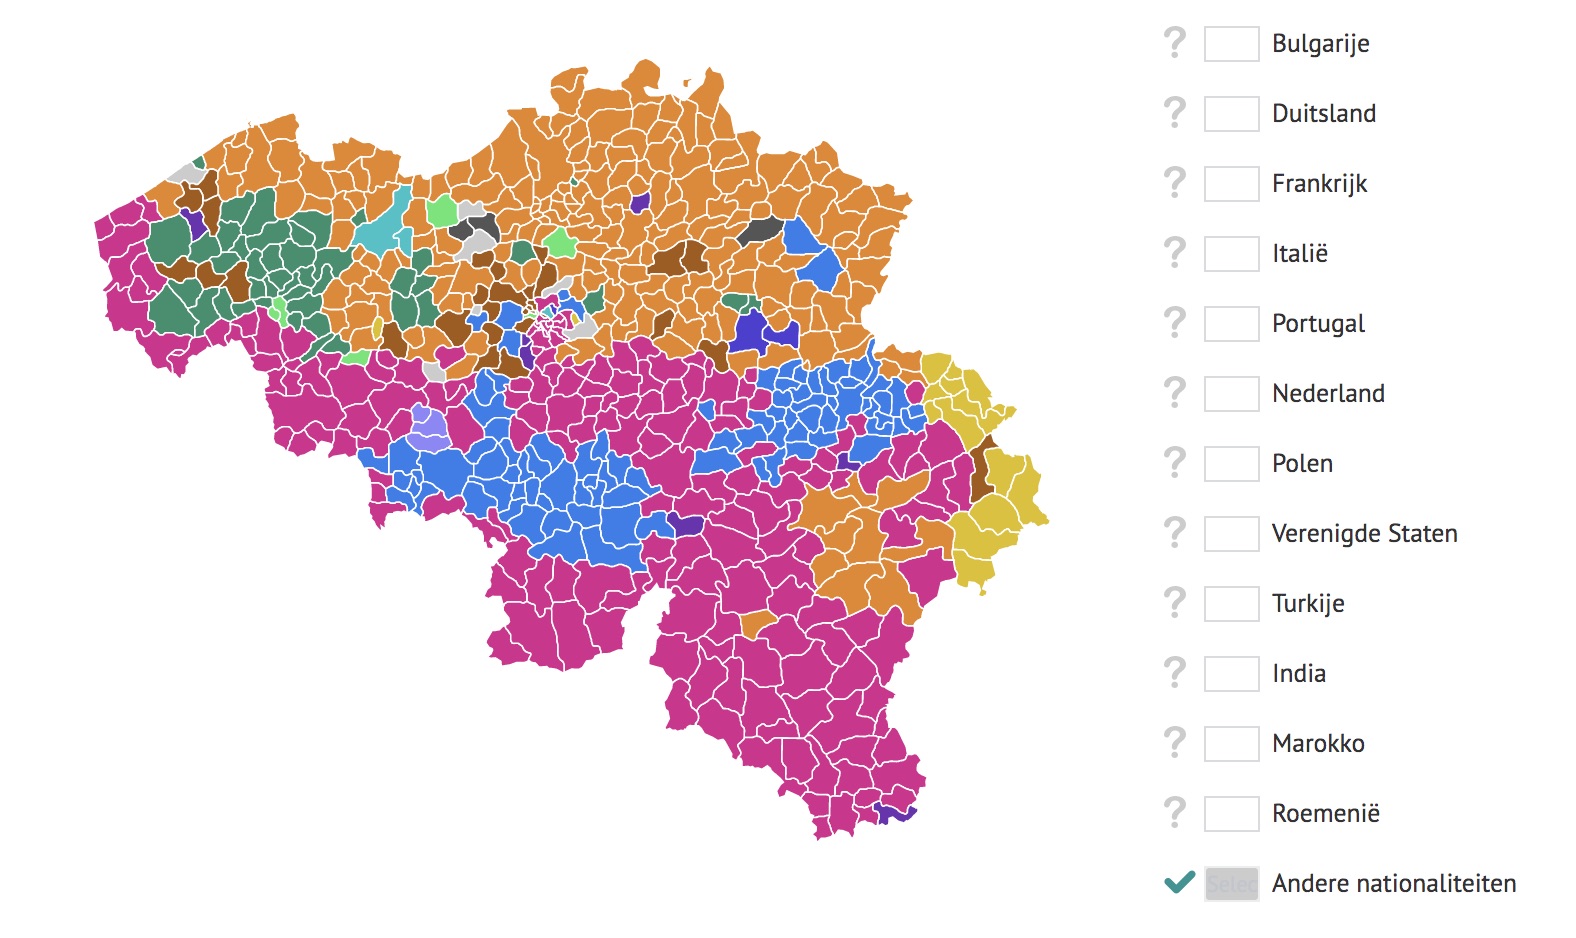
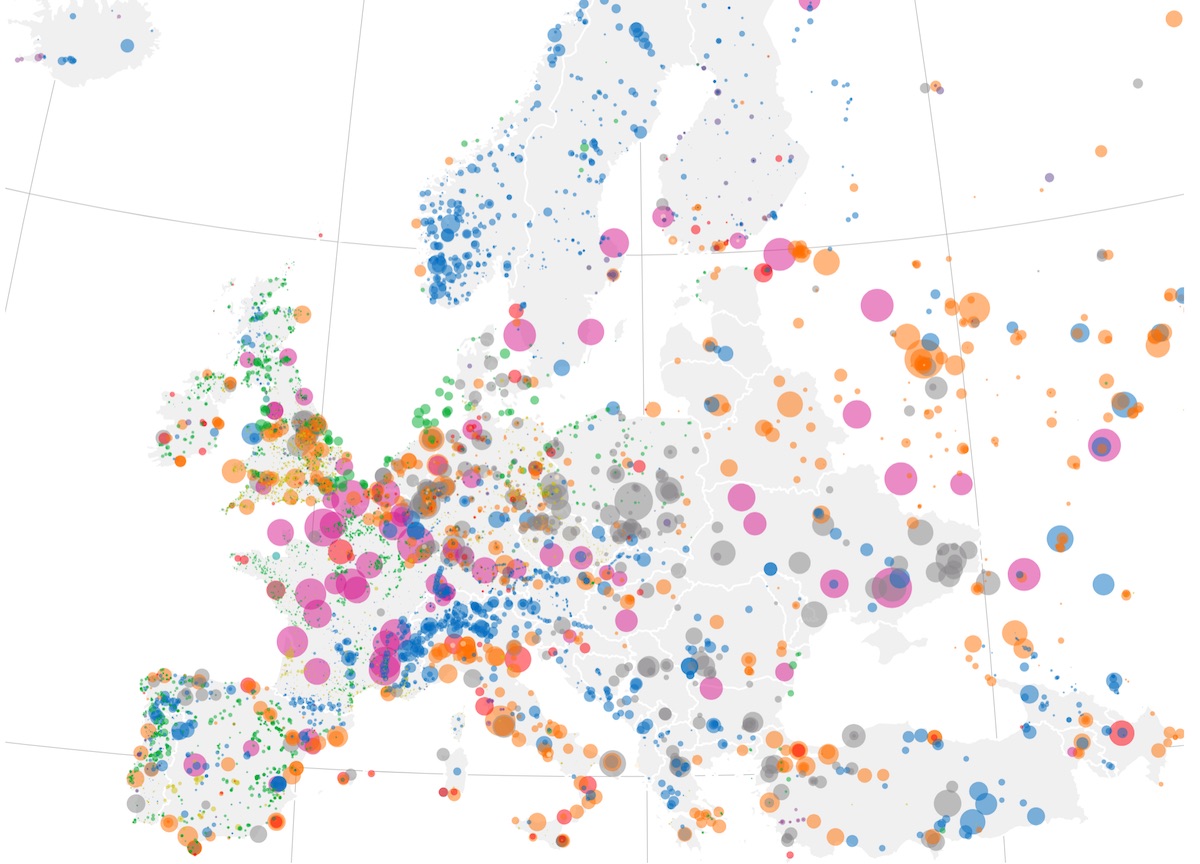
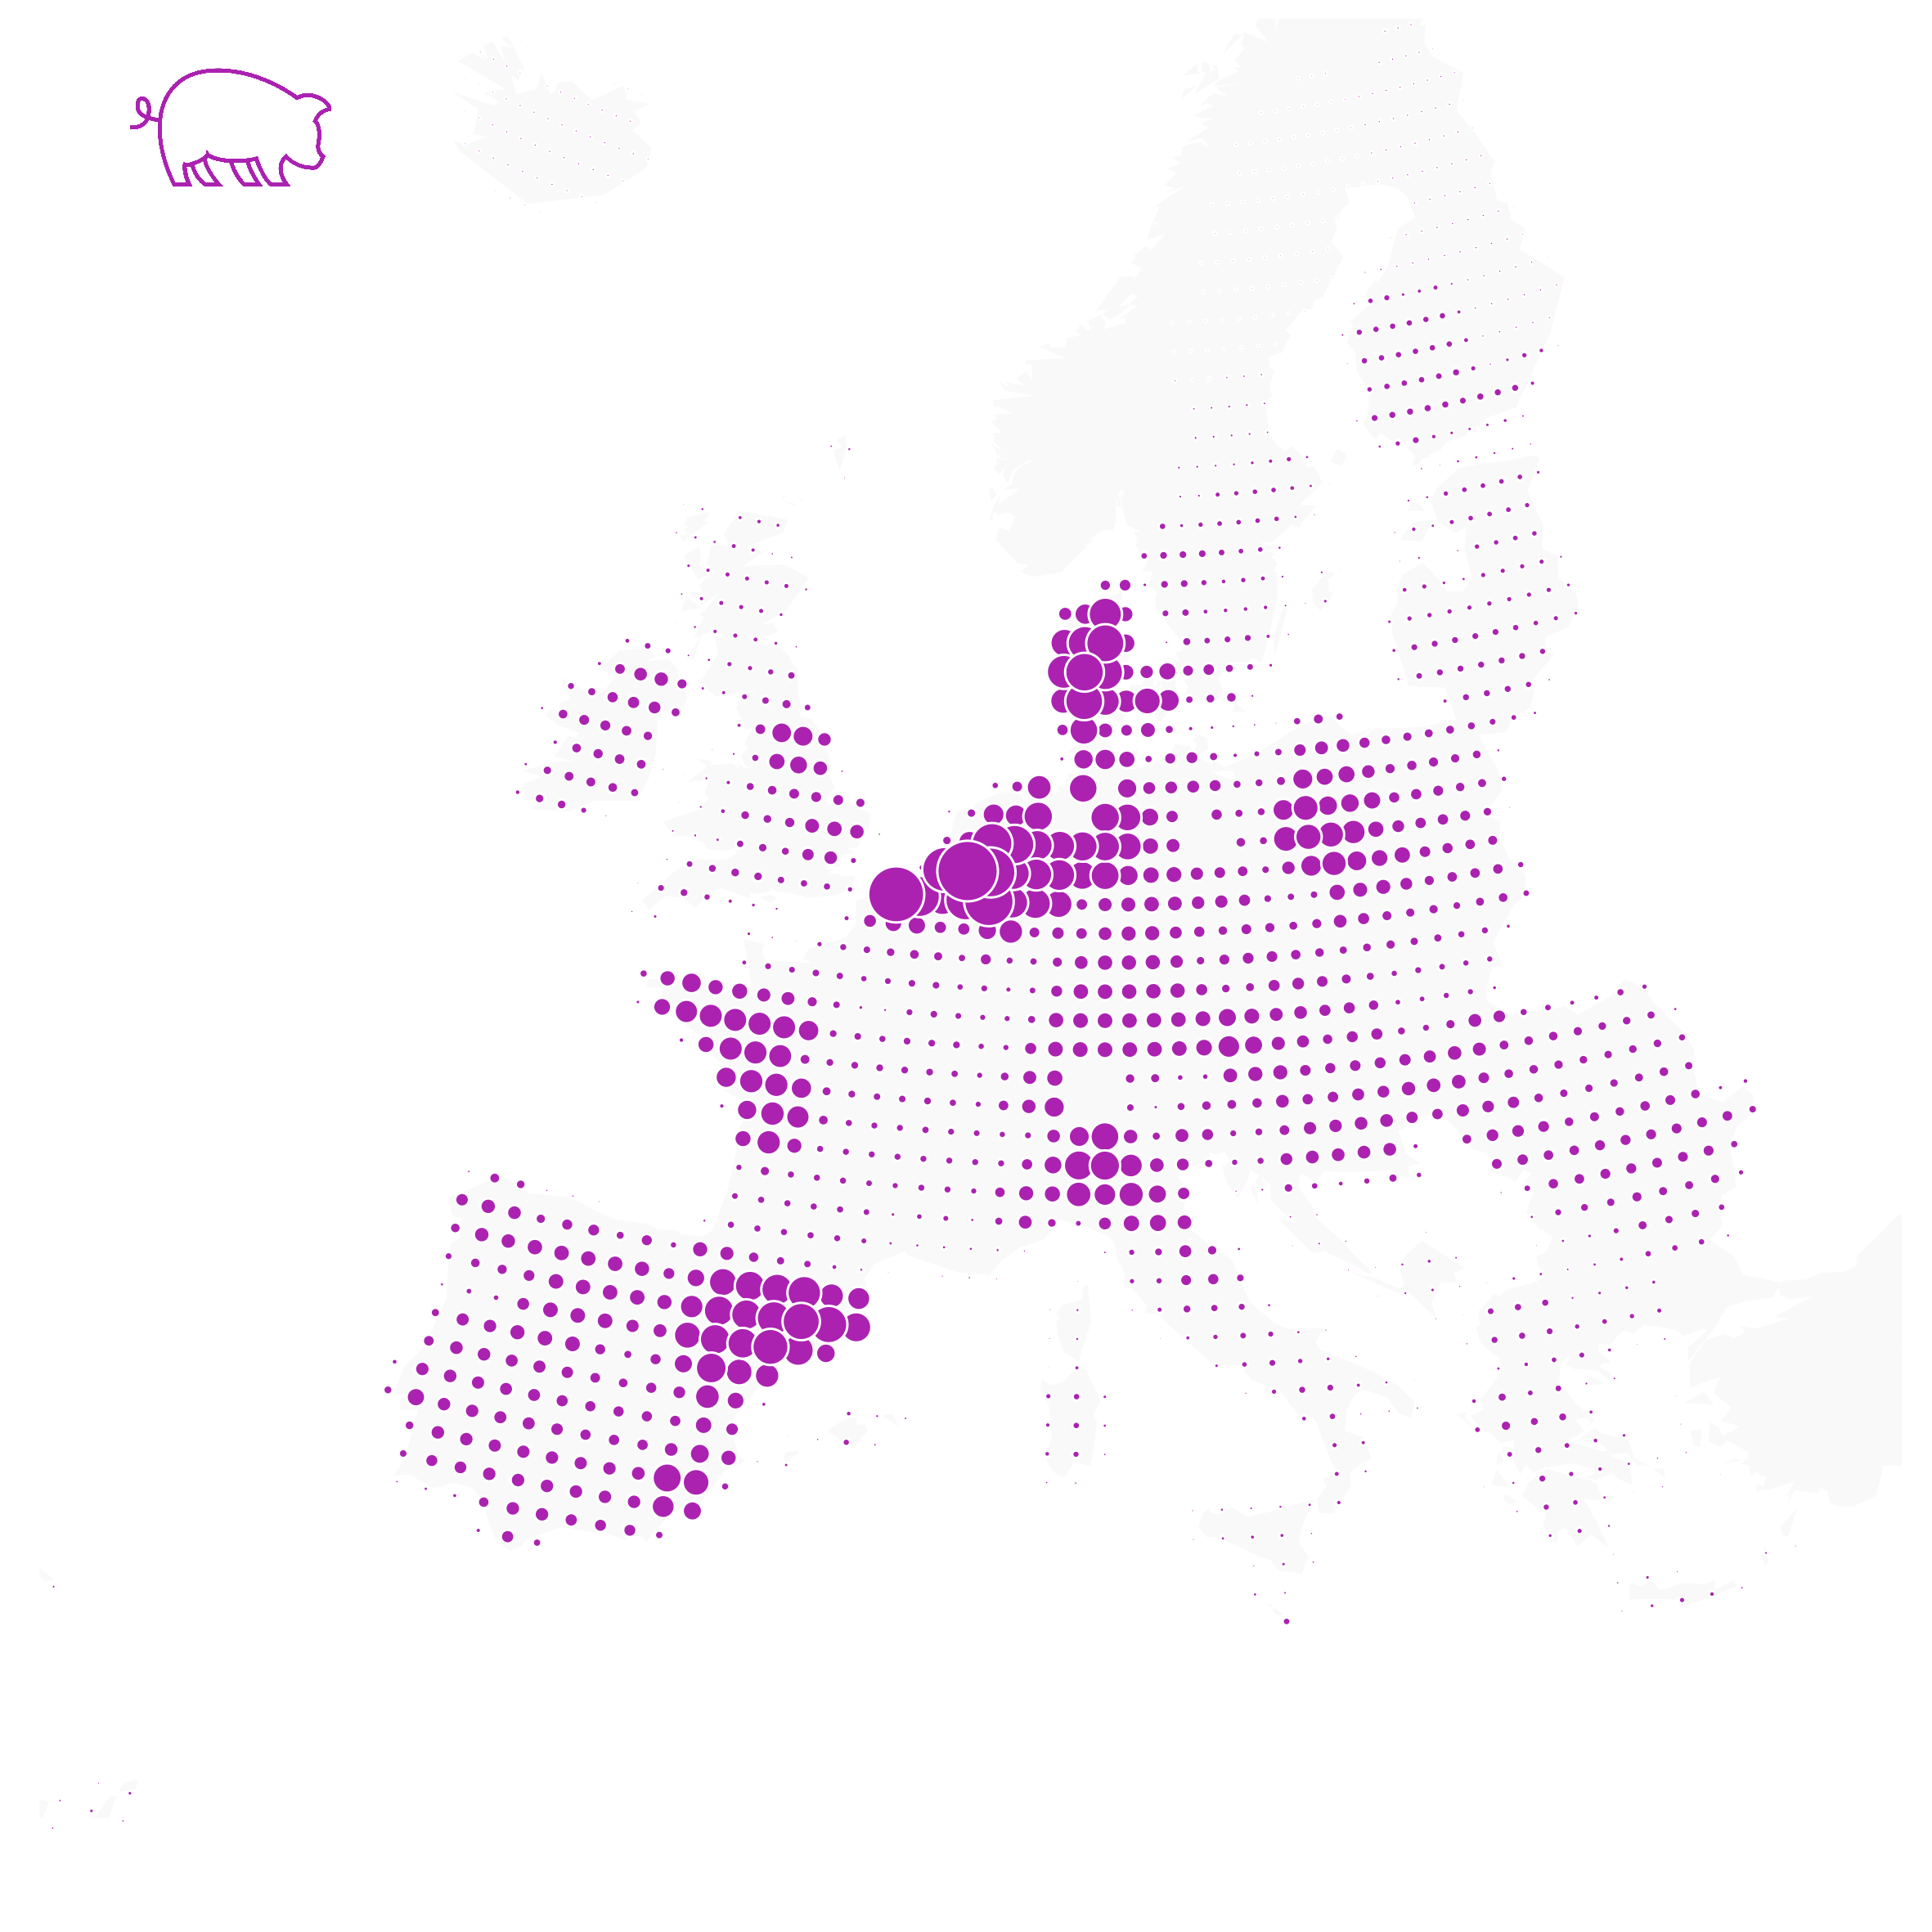
17 visualization heavy data stories

Visualizing a genome collection with CactusTrees

44.435 microbes in one viz

Building the Reuters Polling Explorer

A Chart Management System for polling data

Nationaliteiten in Belgiƫ - een "raad de kaartlegend"-kwis

A guess the map legend quiz

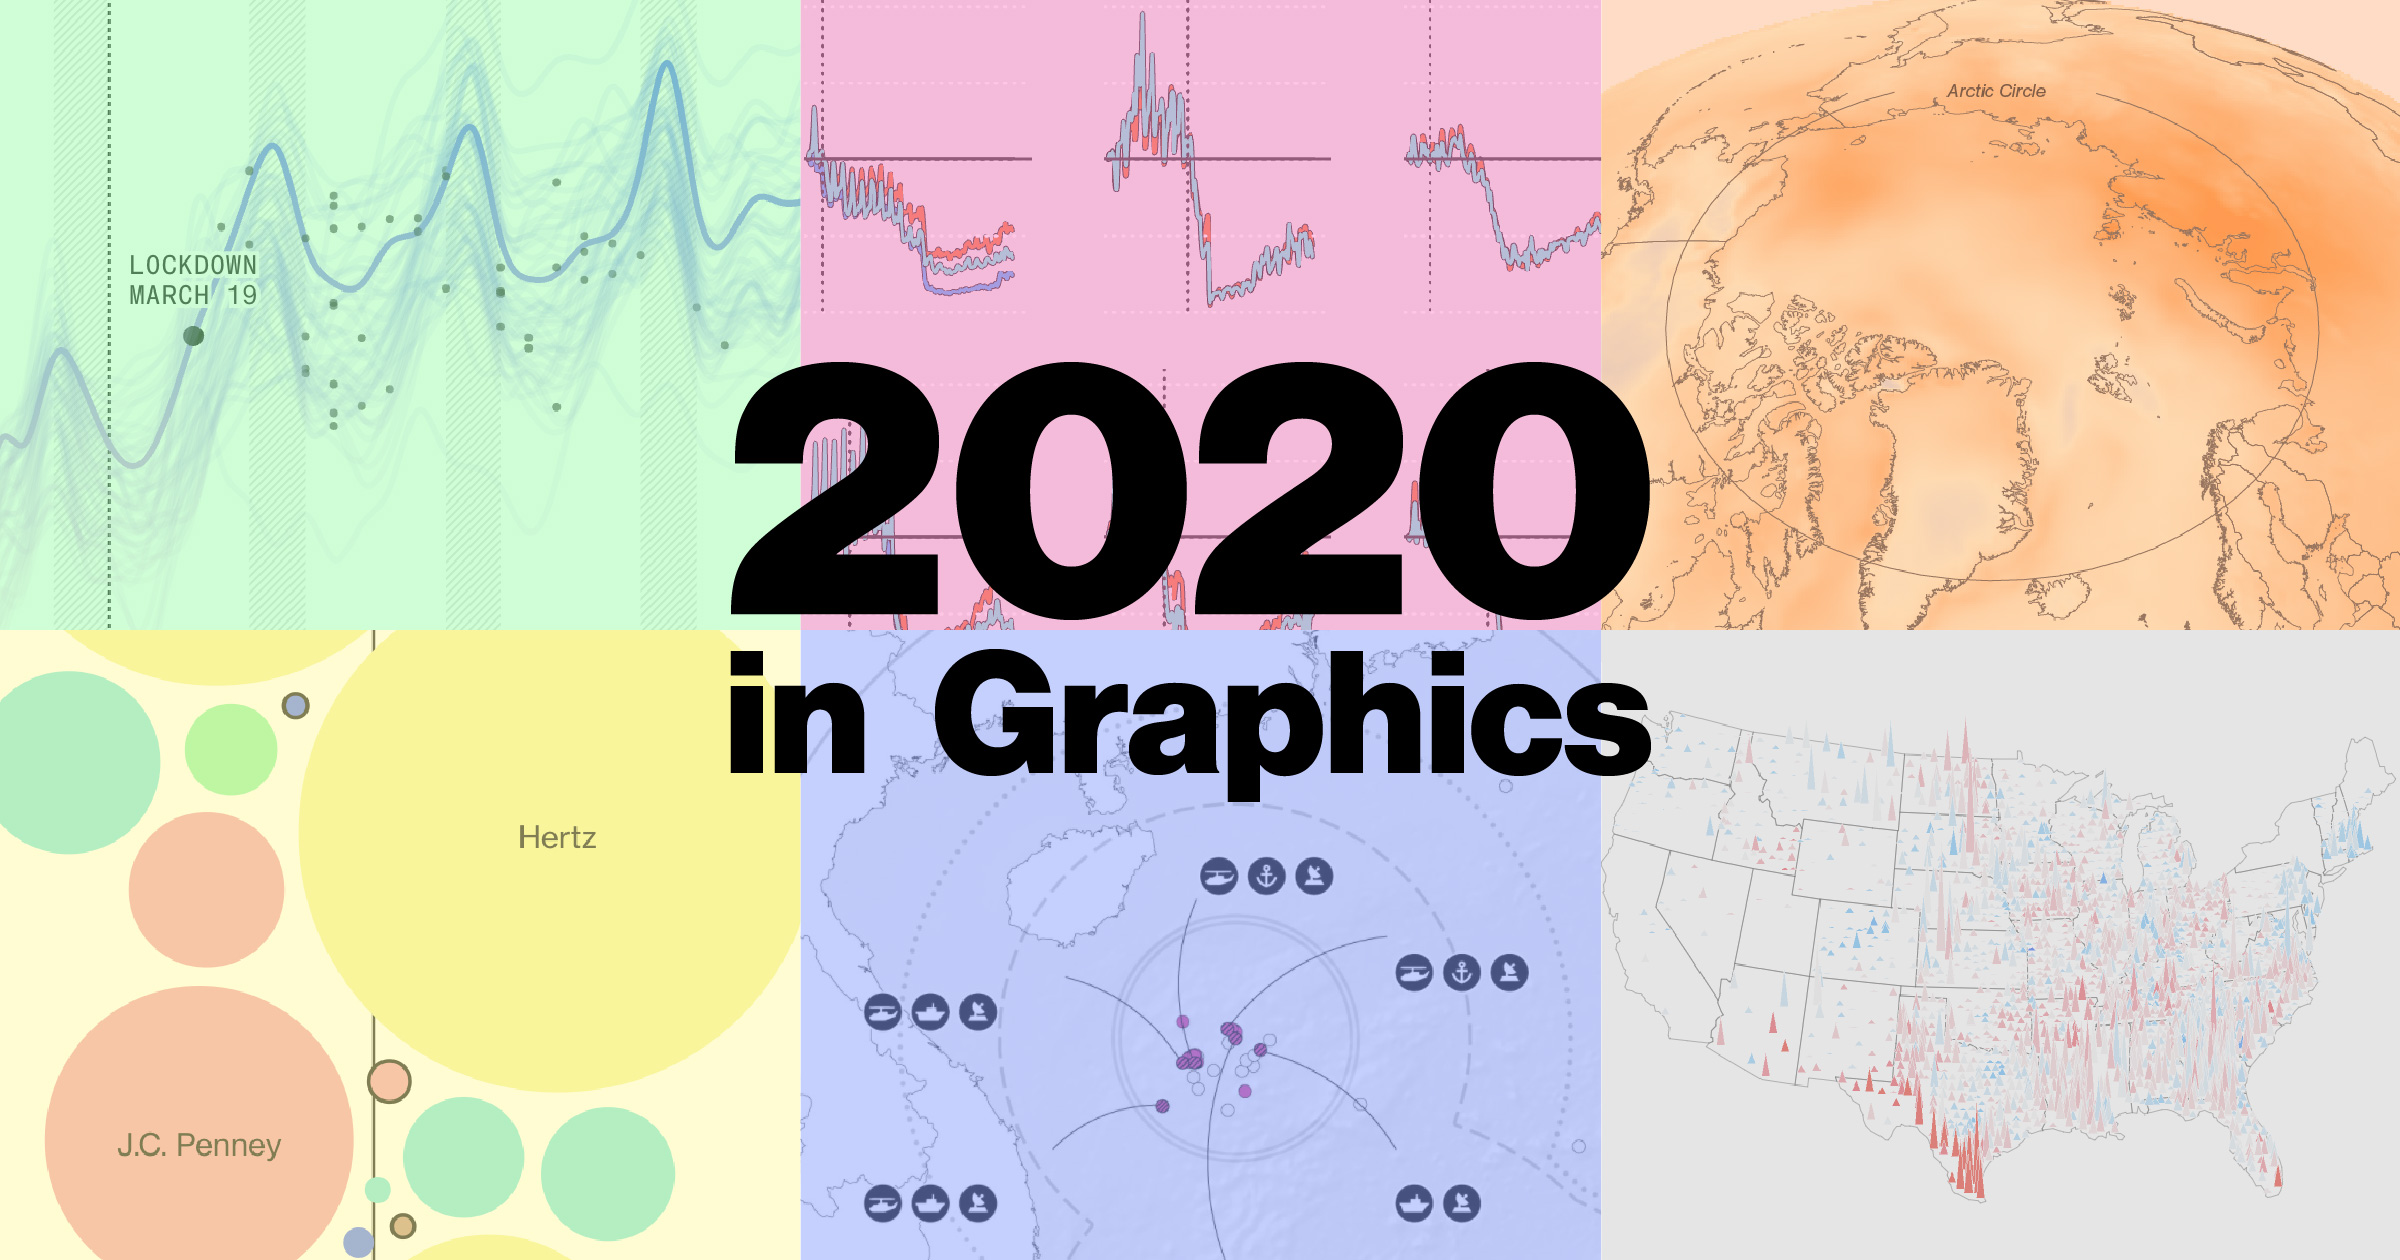
The list of 2020 visualization lists

The year in visual stories, graphics maps and satellite images

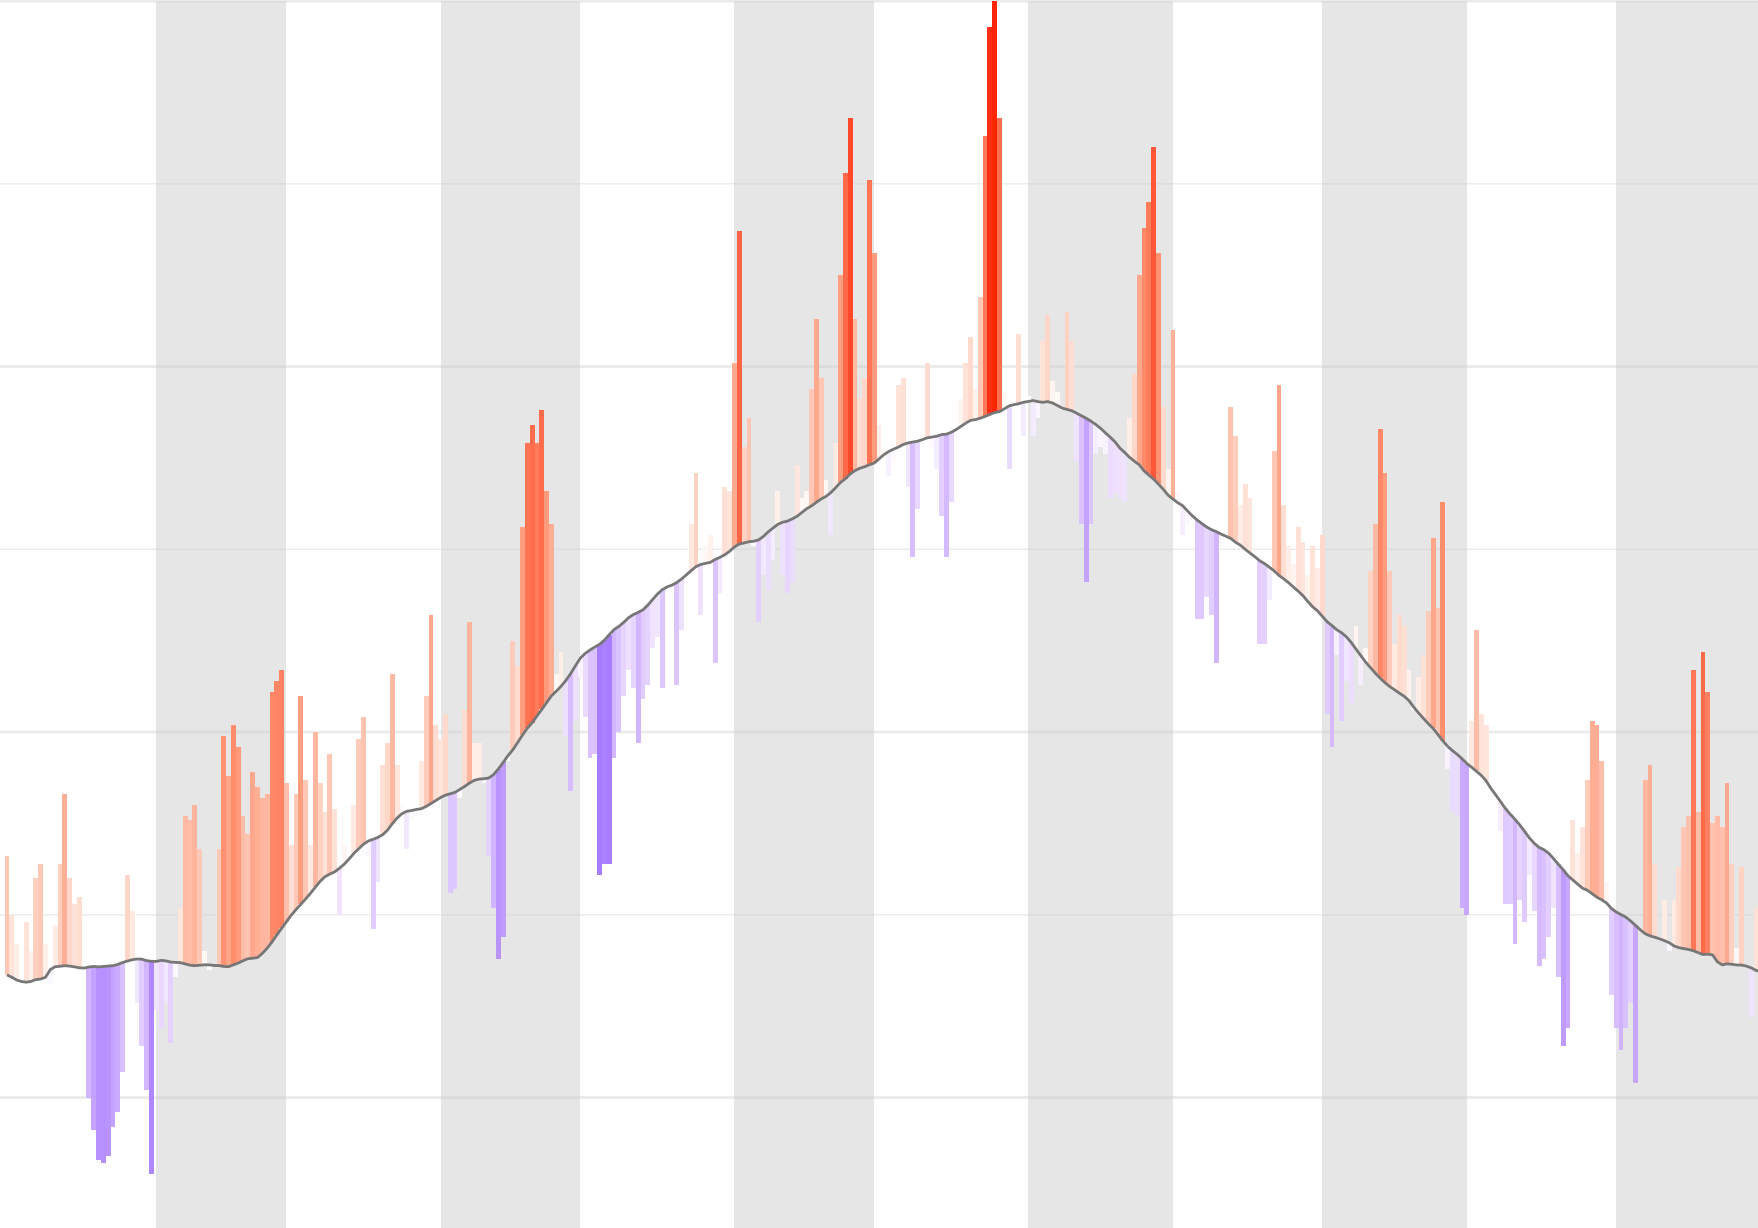
Finally some charts of daily Belgian weather observations

Charts I wanted to make for a long time, but couldn't

The list of 2019 visualization lists

The year in visual stories, graphics maps and satellite images

My #30DayMapChallenge

Let's see how far I get with this

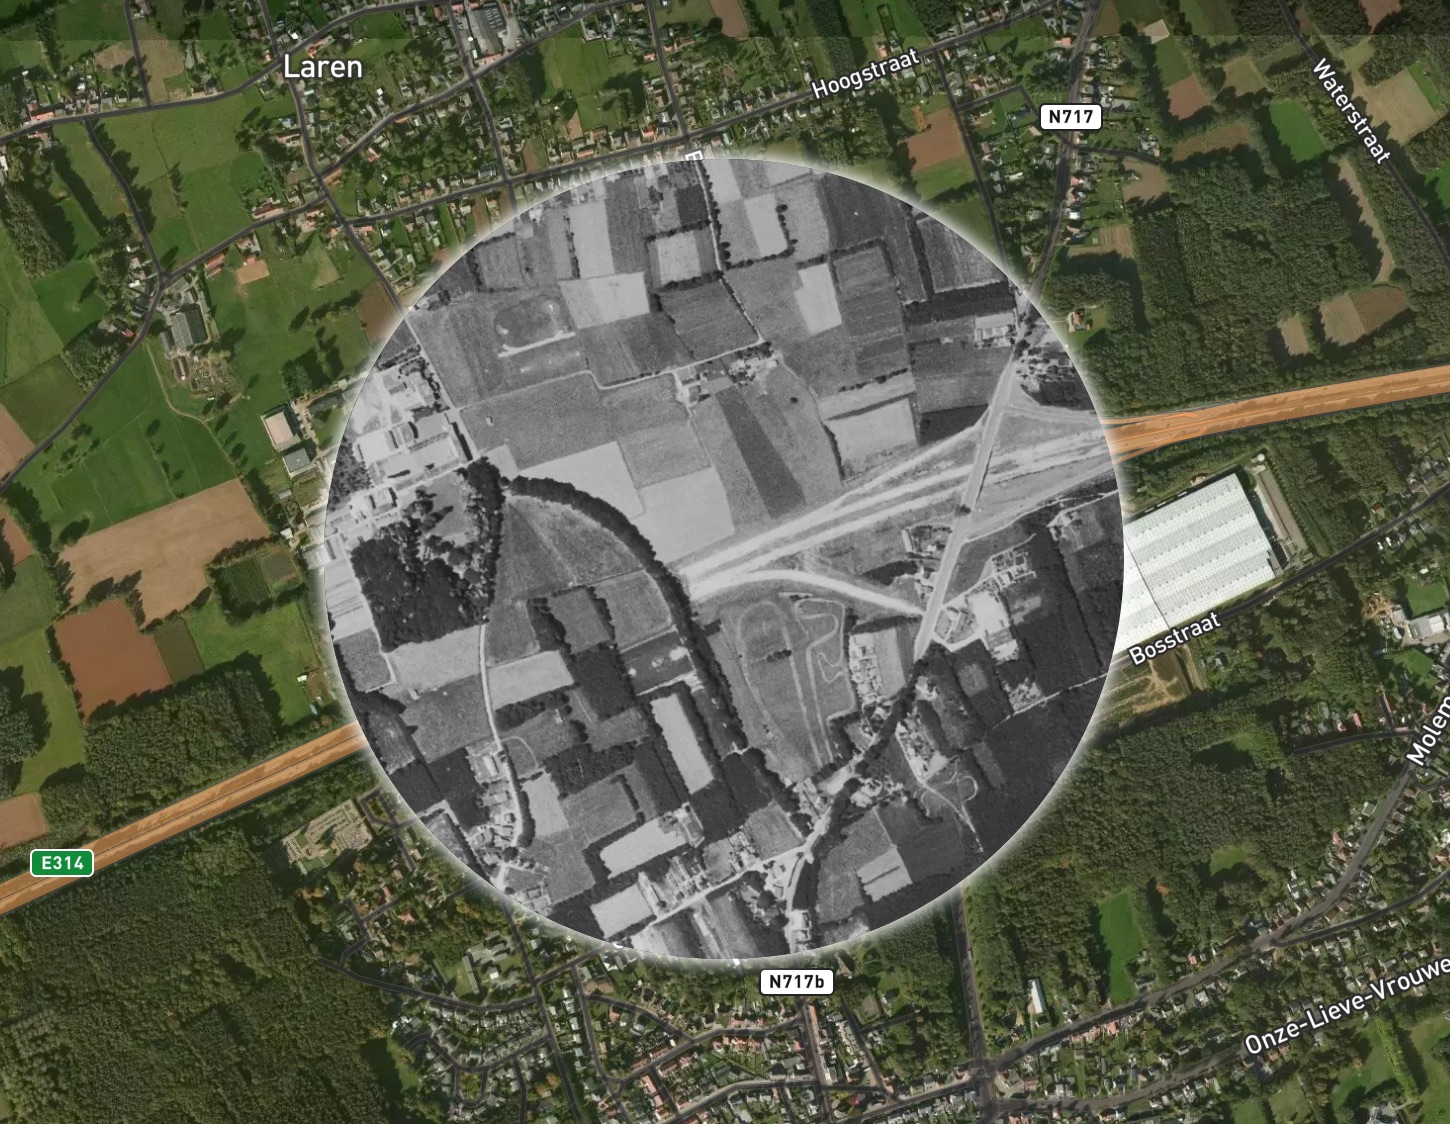
A look through history map of Flanders - the making of

Seamlessly comparing historical aerial imagery to today

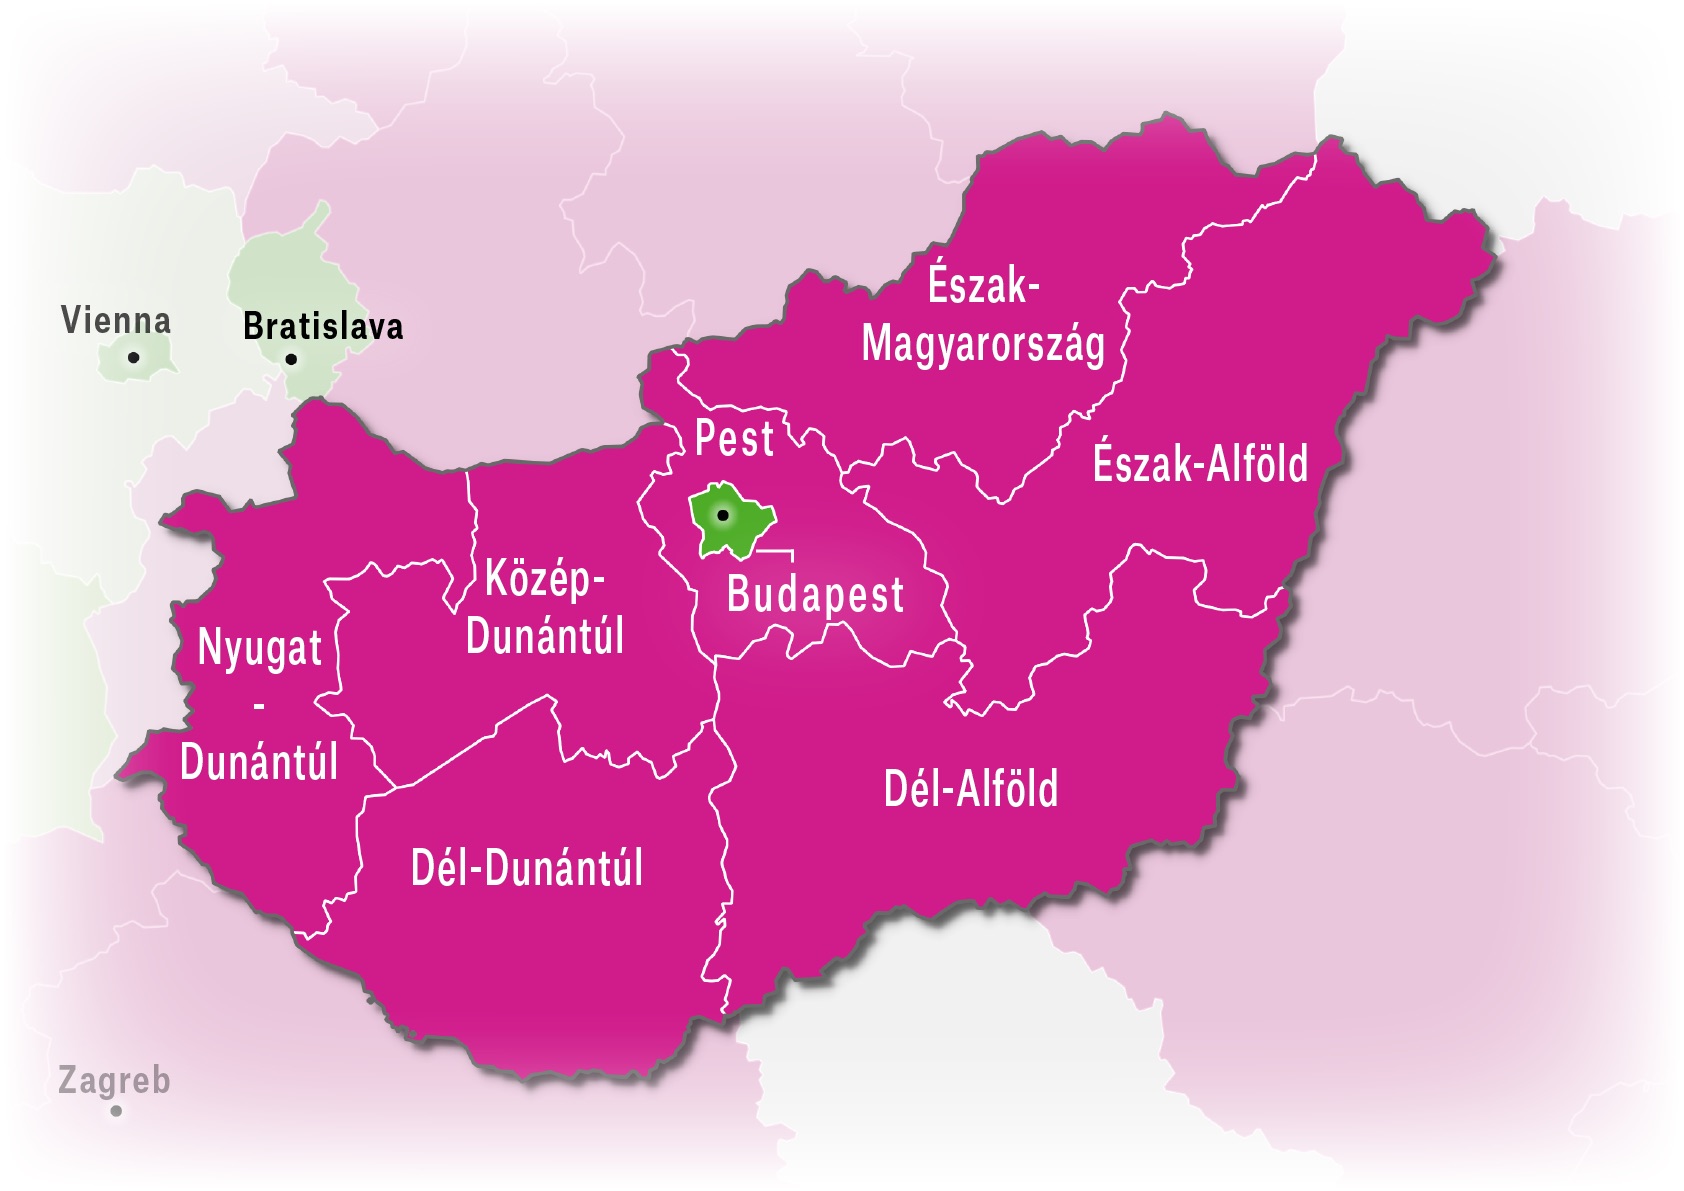
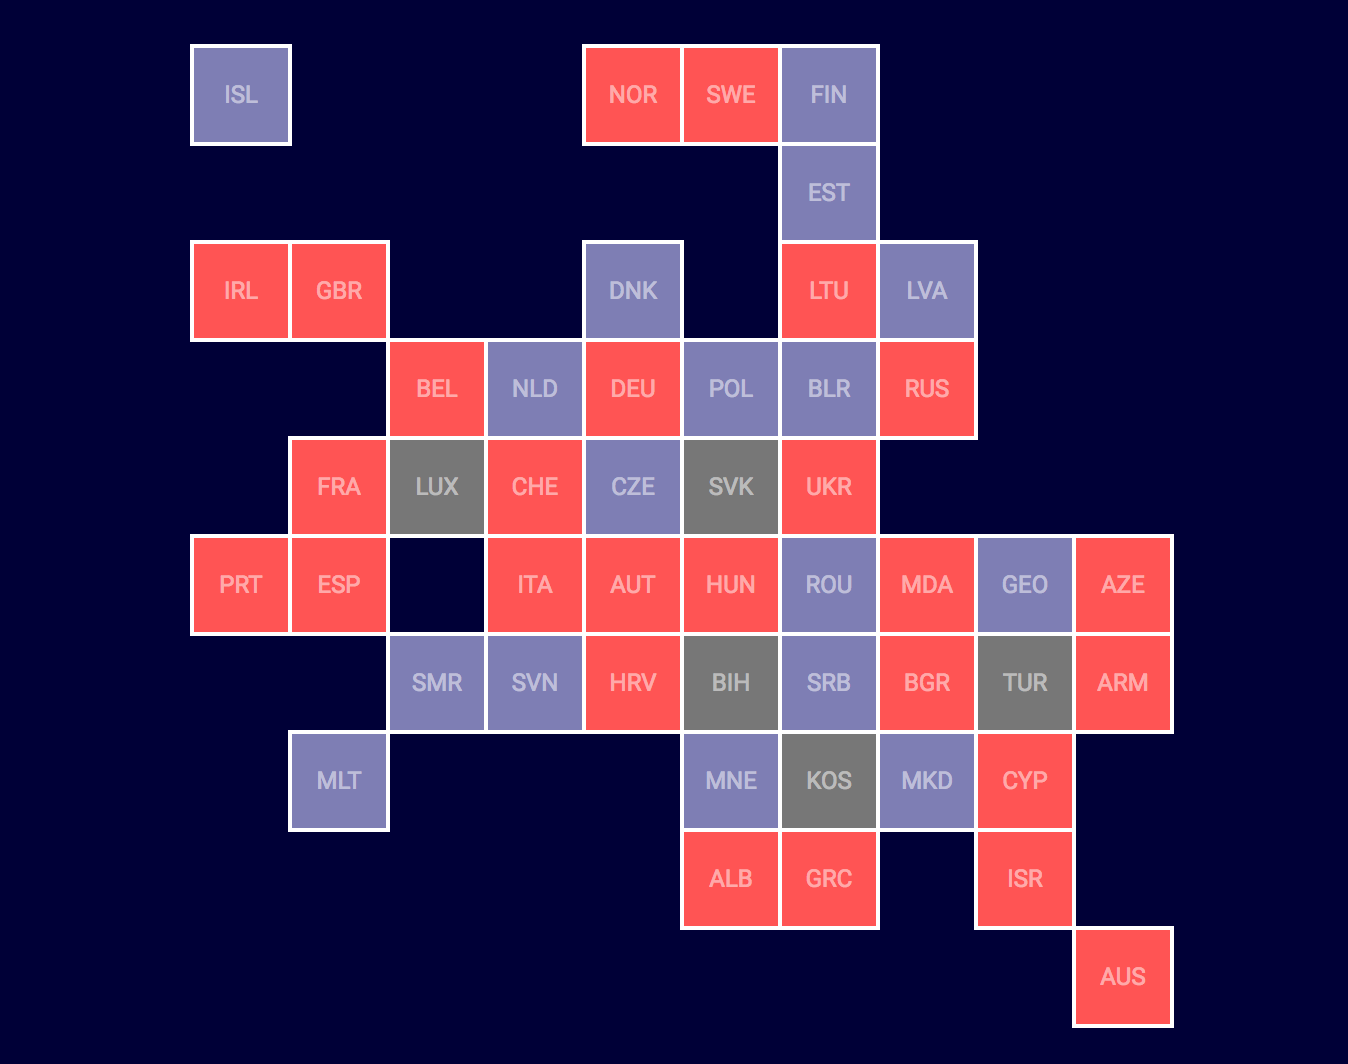
Why Budapest, Warsaw and Lithuania split themselves in two - the making of

My debut on The Pudding

A look back, and a look forwards

Half a year of data visualisation freelancing

The list of 2018 visualization lists

The year in visual stories, graphics maps and satellite images

The Herds of Europe

Bubble grid maps of European livestock

Open data for humans

1 reason your open data isn't really open

One-person-one-dot maps and how to make them

Dot density demistified

My first year as a data visualization freelancer

What I did and learned

The list of 2017 visualization lists

The year in visual stories, graphics and satellite images

Tutorial: a World Tile Grid Map in ggplot2

A square for every country in the world

Making-of: The Eurosearch Song Contest

My collaboration with Google News Lab

Malofiej25: the awards

The full list of online medal winners

Papers, screens and goggles

My contribution to the 25th anniversary Malofiej book

My tribute to Hans Rosling

Thank you for everything, professor

Magic in Graphs

An ode to charts, from 1939

Who should tell the data stories?

Data publishers and media clash for readers attention

The list of 2016 visualization lists

Which ones did I forget?

The charts of 2016

The big events and trends of the year, captured in charts

Moving on

I'm going freelance

Hire me

Just leave a message, email me or tweet me, I will get back to you as soon as possible.

Maarten Lambrechts

maartenzam@gmail.com

+32 488 242 996

Koningin Astridlaan 65
3290 Diest
Belgium

Twitter

LinkedIn